 Uplift Report Options
With the exception of the options described below, all of the red triangle options for the Uplift report are described in the documentation for the Partition platform. For details about these options, see Partition Models in the Predictive and Specialized Modeling book.
 Minimum Size Split
 Column Uplift Contributions
 Uplift Graph
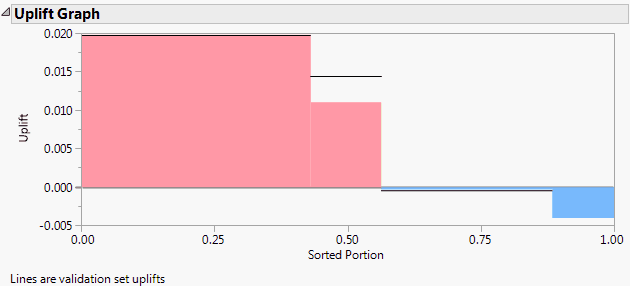
See Figure 7.5 for an example of an Uplift Graph for the Hair Care Product.jmp sample data table after three splits. Note that, for two groups of subjects (males and non-blond women in the Age ≥ 42 group), the promotion has a negative effect.
Figure 7.5 Uplift Graph
 Save Columns