This example uses the Failures.jmp sample data table, which contains failure data and a frequency column. It lists causes of failure during the fabrication of integrated circuits and the number of times each type of defect occurred for two processes. A constant sample size of 1000 is specified for this example.
|
1.
|
|
2.
|
|
3.
|
|
4.
|
|
5.
|
|
6.
|
|
7.
|
|
8.
|
Click OK.
|
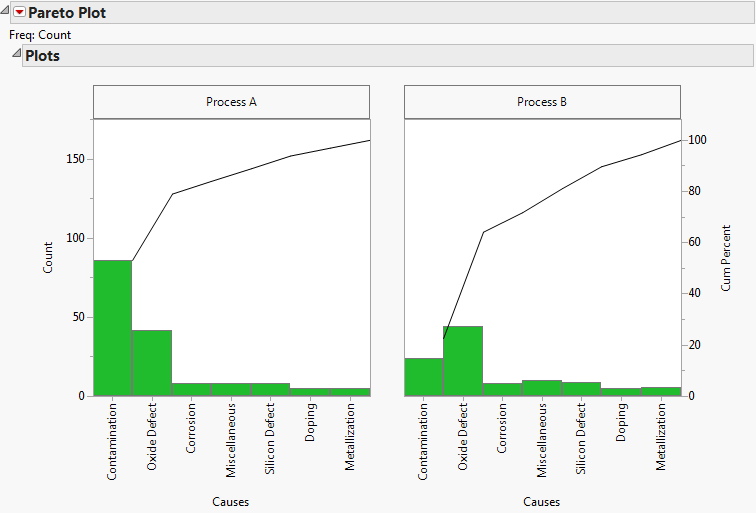
Figure 11.10 Pareto Plot Report Window
|
9.
|
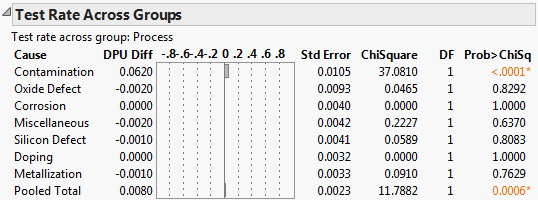
Figure 11.11 Test Rates across Groups Results