Note: To permanently hide the comparison circles plot, select File > Preferences > Platforms > Oneway and deselect the Comparison Circles option.
Each multiple comparison test, except for the Each Pair Stepwise, Newman-Keuls method, begins with a comparison circles plot, which is a visual representation of group mean comparisons. Figure 5.59 shows the comparison circles for the All Pairs, Tukey HSD method. Other comparison tests lengthen or shorten the radii of the circles.
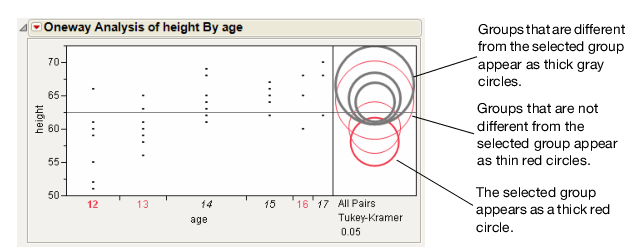
Figure 5.59 Visual Comparison of Group Means
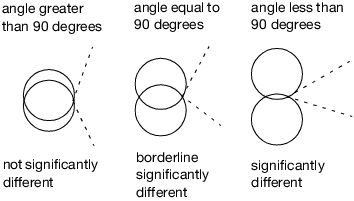
Compare each pair of group means visually by examining the intersection of the comparison circles. The outside angle of intersection tells you whether the group means are significantly different. See Figure 5.60.
Figure 5.60 Angles of Intersection and Significance
If the intersection angle is close to 90 degrees, you can verify whether the means are significantly different by clicking on the comparison circle to select it. See Figure 5.61. To deselect circles, click in the white space outside the circles.
Figure 5.61 Highlighting Comparison Circles