|
1.
|
Click the Response Y red triangle and select Factor Profiling > Contour Profiler.
|
|
2.
|
Click the Contour Profiler red triangle menu and select Contour Grid.
|
|
3.
|
For Increment, type 1.
|
|
4.
|
Click OK.
|
|
5.
|
Click the Prediction Profiler red triangle menu and select Factor Settings > Link Profilers.
|
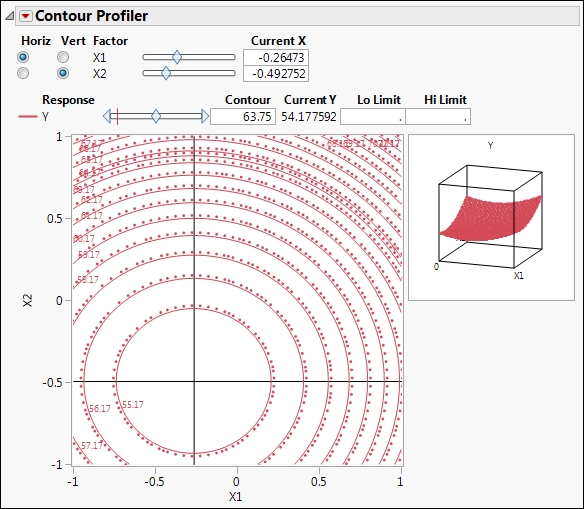
Linking the Contour Profiler to the Prediction Profiler links the Current X values in the Contour Profiler to the X values shown in the Prediction Profiler. The X values in the Prediction Profiler give the critical point where Y is minimized. The crosshairs in the Contour Profiler show the critical point. Notice that the Current Y value is 54.177592, the predicted minimum value according to the Prediction Profiler.
Often, it is not possible to set your process factors to exactly the values that optimize the response. The Contour Profiler can help you identify alternate settings of the process factors. In the next steps, suppose that you can only set your process to X1 and X2 values with one decimal place precision, and that your process settings may vary by one decimal place in either direction of those settings.
|
6.
|
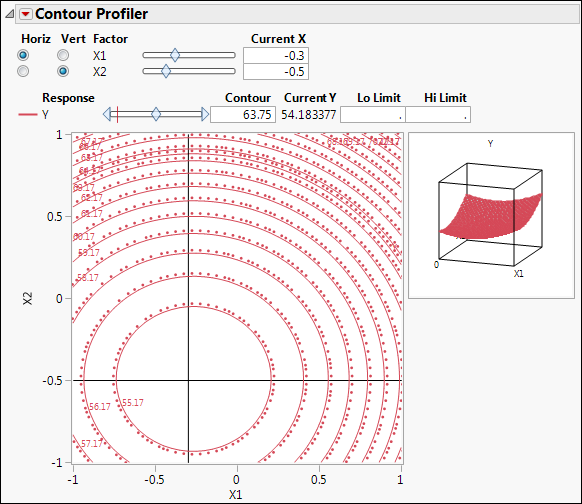
Figure 3.18 Contour Profiler Showing X1 = -0.3 and X2 = -0.5
|
7.
|