Use the Compare Means options to perform multiple comparisons of group means. All of these methods use pooled variance estimates for the means. Each Compare Means option adds comparison circles next to the plot and specific reports to the report window. For details about comparison circles, see Using Comparison Circles.
|
Computes individual pairwise comparisons using Student’s t-tests. If you make many pairwise tests, there is no protection across the inferences. Therefore, the alpha-size (Type I error rate) across the hypothesis tests is higher than that for individual tests.
|
|||
|
Shows a test that is sized for all differences among the means. This is the Tukey or Tukey-Kramer HSD (honestly significant difference) test. (Tukey 1953, Kramer 1956). This test is an exact alpha-level test if the sample sizes are the same, and conservative if the sample sizes are different (Hayter 1984).
|
|||
Note: If you have specified a Block column, then the multiple comparison methods are performed on data that has been adjusted for the Block means.
Each multiple comparison test begins with a comparison circles plot, which is a visual representation of group mean comparisons. Visual Comparison of Group Means shows the comparison circles for the All Pairs, Tukey HSD method. Other comparison tests lengthen or shorten the radii of the circles.
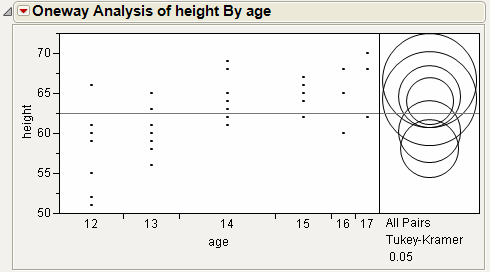
Compare each pair of group means visually by examining the intersection of the comparison circles. The outside angle of intersection tells you whether the group means are significantly different. See Angles of Intersection and Significance.
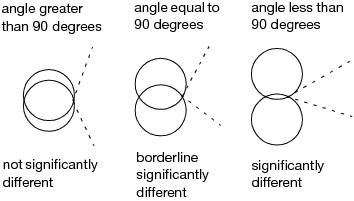
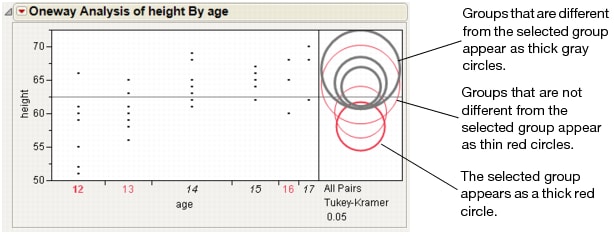
If the intersection angle is close to 90 degrees, you can verify whether the means are significantly different by clicking on the comparison circle to select it. See Highlighting Comparison Circles. To deselect circles, click in the white space outside the circles.
The Each Pair, Student’s t test shows the Student’s t-test for each pair of group levels and tests only individual comparisons.
The All Pairs, Tukey HSD test (also called Tukey-Kramer) protects the significance tests of all combinations of pairs, and the HSD intervals become greater than the Student’s t pairwise LSDs. Graphically, the comparison circles become larger and differences are less significant.
The With Best, Hsu MCB test determines whether the mean for a given level exceeds the maximum mean of the remaining levels, or is smaller than the minimum mean of the remaining levels. See Hsu, 1996.
The quantiles for the Hsu MCB test vary by the level of the categorical variable. Unless the sample sizes are equal across levels, the comparison circle technique is not exact. The radius of a comparison circle is given by the standard error of the level multiplied by the largest quantile value. Use the p-values of the tests to obtain precise assessments of significant differences. See Comparison with Max and Min.
The report shows p-values for one-sided Dunnett tests. For each level other than the best, the p-value given is for a test that compares the mean of the sample best level to the mean of each remaining level treated as a control (potentially best) level. The p-value for the sample best level is obtained by comparing the mean of the second sample best level to the mean of the sample best level treated as a control.
For each level of the categorical variable, this column gives a p-value for a test that the mean of that level exceeds the maximum mean of the remaining levels. Use the tests in this column to screen out levels whose means are significantly smaller than the (unknown) largest true mean.
For each level of the categorical variable, this column gives a p-value for a test that the mean of that level is smaller than the minimum mean of the remaining levels. Use the tests in this column to screen out levels whose means are significantly greater than the (unknown) smallest true mean.
For the maximum report, a column shows the row mean minus the column mean minus the LSD. If a value is positive, the row mean is significantly higher than the mean for the column, and the mean for the column is not the maximum.
For the minimum report, a column shows the row mean minus the column mean plus the LSD. If a value is negative, the row mean is significantly less than the mean for the column, and the mean for the column is not the minimum.
The With Control, Dunnett’s test compares a set of means against the mean of a control group. The LSDs that it produces are between the Student’s t and Tukey-Kramer LSDs, because they are sized to refrain from an intermediate number of comparisons.
In the Dunnett’s report, the  quantile appears, and can be used in a manner similar to a Student’s t-statistic. The LSD threshold matrix shows the absolute value of the difference minus the LSD. If a value is positive, its mean is more than the LSD apart from the control group mean and is therefore significantly different.
|
Shows the t-value or other corresponding quantiles used for confidence intervals.
|
|
|
Shows a detailed report for each comparison. Each section shows the difference between the levels, standard error and confidence intervals, t-ratios, p-values, and degrees of freedom. A plot illustrating the comparison appears on the right of each report.
|