To produce the plot shown in Example of a Contingency Table, follow the instructions in Example of Contingency Analysis.
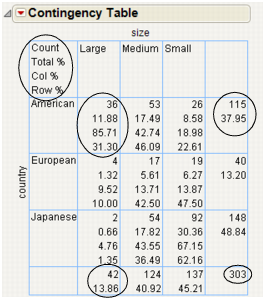
For example, in Example of a Contingency Table, focus on the cars that are large and come from America. The following table explains the conclusions that you can make about these cars using the Contingency Table.
|
Expected frequency (E) of each cell under the assumption of independence. Computed as the product of the corresponding row total and column total divided by the grand total.
|
|