|
If the contour plot includes a Color role, the Transform option is enabled. See Example of Triangulation, Transform, and Alpha Shapes for details.
|
|
|
Shows or hides the label (z-value) of the contour lines.
|
|
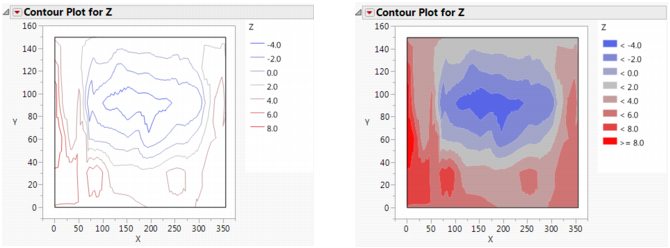
If you select Fill Areas, the areas between contour lines are filled with the contour line colors. This option is available in the Launch window and in the red triangle menu for Contour Plot. Comparison of Contour Lines and Area Fills shows a plot with contour lines on the left and a plot with the contour areas filled on the right.
If you do not select options in the Launch window, the default plot spaces the contour levels equally within the range of the Y variable. The default colors are assigned via the Continuous Color Theme in Preferences. You can see the colors palette with the Colors command in the Rows menu or by right-clicking on an item in the Contour Plot legend.
You can specify contour levels either in the Launch window (the Specify button) or in the report window from the red triangle menu for Contour Plot (the Specify Contours option).
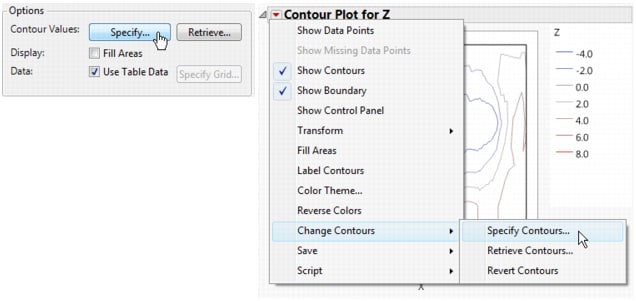
This option is both in the Launch window and on the red triangle menu for Contour Plot (the Specify Contours option).
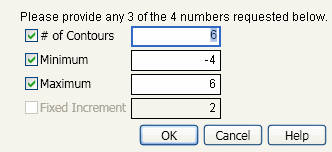
Selecting this option displays the Contour Specification window. See The Contour Specification Window. Using this window, you can do the following:
This option is both in the Launch window (the Retrieve button) and on the red triangle menu for Contour Plot (the Retrieve Contours option).
Note: Neither the button nor the menu option are active unless there is an open data table in addition to the table that has the contour plotting values. When you click Retrieve or select Retrieve Contours, a window with a list of open data tables appears.
Save Contours creates a new JMP data table with columns for the following:
|
•
|
Generate Grid displays a window that prompts you for the grid size that you want. When you click OK, the Contour platform creates a new JMP data table with the following:
Save Triangulation creates a new JMP data table that lists coordinates of each triangle used to construct the contours. By default, JMP uses Delaunay triangulation to connect the nearest data points to form triangles. The resulting set of triangles are calculated so that no other data points are inside a triangle’s circumscribed circle, that is, the circle that passes through the three vertices of the triangle. To change the triangulation to a normalized scale, select Transform > Range Normalized.
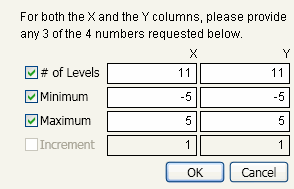
Most often you construct a contour plot for a table of recorded response values such as the Little Pond data table. In that case, in the launch window, Use Table Data is checked and the Specify Grid button is unavailable. However, if a column has a formula and you specify that column as the response (Y), the Specify Grid button becomes active.
When you click Specify Grid, the window shown in Example of the Contour Specification for Formula Column appears.