Hypothetical Choice Survey Results from a Single Respondent, Subject ID 2 shows hypothetical results from a single survey designed to collect information about consumer preferences for laptop computers.
|
•
|
|
•
|
Each line in the survey defines a laptop profile, which is a collection of attribute values.
|
|
•
|
Each choice set consists of two attribute profiles.
|
The DOE Choice designer can create a survey like that shown in Hypothetical Choice Survey Results from a Single Respondent, Subject ID 2. However, to create an effective design, the Choice designer needs information about the attributes. For example, most laptop attributes have values that are intrinsic preferences. That is, a bigger disk size is better, longer battery life is better, and so on. The purpose of conducting a choice survey is to find out how potential laptop purchasers feel about the advantages of a collection of attributes.
The Choice design can create a survey like the one in Hypothetical Choice Survey Results from a Single Respondent, Subject ID 2.
|
1.
|
Choose DOE > Choice Design, and complete the initial window as shown in Choice Design Window with Attributes Defined.
|
|
2.
|
Click Continue. For this example, use the default values in the DOE Model Controls and Design Generation panels, as shown in Design Generation Panel for the Laptop Experiment.
|
|
3.
|
Click Make Design to see the example survey results in Survey Results Based on a Simple Model and Default Prior Information.
|
|
4.
|
Select Combine profiles and responses in one table beneath the design settings to generate the survey settings and survey results in the same table.
|
|
5.
|
Click Make Table.
|
Once a survey design is complete, a respondent chooses one profile from each set, entering ‘1’ for the chosen profile and ‘0’ for the rejected profile. Suppose a respondent completed the example survey as shown in JMP Table with Survey Choice Sets and Responses. You can now analyze these results using the Choice platform in the Analyze menu (Analyze > Consumer Research > Choice).
|
1.
|
Click the Choice script in the Laptop Design sample data table and select Run Script to analyze those data with the Choice modeling platform from the Analyze menu.
|
When you run the Choice model script, the Choice platform launch window shown in Choice Model Fitting Dialog appears. The Choice window is designed to cover a variety of choice survey results, which can include data saved in multiple data tables. This example shows all data in a single table. For details about using the Choice analysis platform, see the Choice platform chapter in the Consumer Research book.

|
2.
|
Click Run Model on the Choice model fitting window.
|
|
3.
|
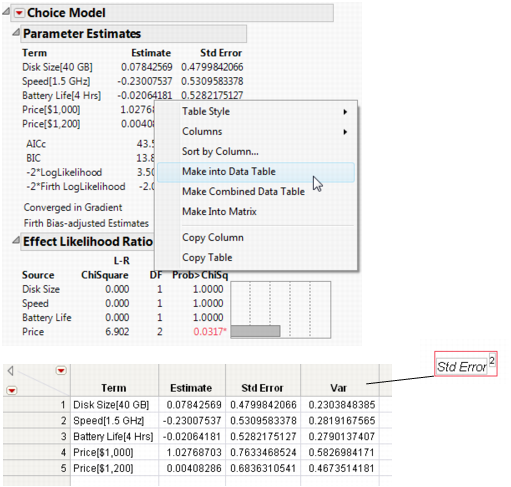
To design the final choice survey using prior information, you need to enter estimates of the mean and variance of the attribute parameter estimates. The analysis on the top in Analysis of the Sample Laptop Survey has estimates of the attribute means, called Estimate, and estimates of the standard deviation of the attributes, called Std Error. An easy way to see the variance of the attributes is to capture the analysis in a JMP table and compute the variance.
|
4.
|
Right-click the Parameter Estimates report and select Make into Data Table from the menu, as shown.
|
|
5.
|
|
6.
|
Select Formula from the Cols menu (Cols > Formula), or right-click the Var column and select Formula.
|
|
7.
|
In the Formula Editor, click the Std Error column in the column list and click the exponent button (
|
Note: Leave the Untitled data table with the mean and variance information open to be used in the next example.
|
1.
|
|
2.
|
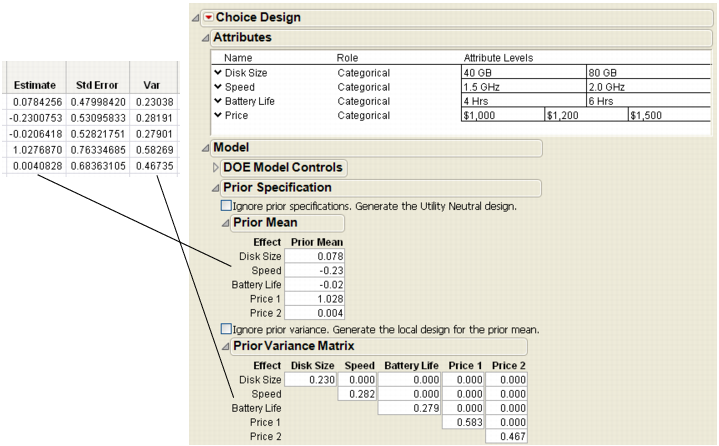
Click Continue to see the Choice design panels in Enter Prior Mean and Variance Information from Preliminary Survey.
|
|
3.
|
Now enter the values from the JMP table created by the previous analysis into the Prior Mean and Prior Variance Matrix panels of the Choice Design window, as shown in Enter Prior Mean and Variance Information from Preliminary Survey. You can copy-and-paste to transfer the values from the data table to the Choice window panels.
|
|
4.
|
In the Design Generation panel, enter 2 for the number of surveys and five for the expected number of respondents per survey, as shown in Design Specifications for Final Laptop Survey. This gives us a total of 10 respondents.
|
|
5.
|
|
6.
|
Click Make Table. The final data table has runs for ten survey respondents, giving a total of 160 observations (2 profiles * 8 choice sets * 2 surveys * 5 respondents = 160 observations).
|
The survey data table with its results is stored in the Sample Data Design Experiment folder installed with JMP. Choice Model Fitting Window to Analyze the Laptop Survey is a partial listing of the survey data table with results. The Choice script created by the Choice designer and saved with the survey data table can be used to analyze the data. The default data table created by the Choice designer is named Choice Profiles. Note in Choice Model Fitting Window to Analyze the Laptop Survey, the data table name is changed to Laptop Results.
|
1.
|
To continue the example, open the table called Laptop Results.jmp, saved in the sample data folder.
|
|
2.
|
To analyze the data, click the Choice script saved with the data and select Run Script from the menu to see the completed window shown in Choice Model Fitting Window to Analyze the Laptop Survey.
|
Note that this window has three grouping variables (Respondent, Survey, and Choice Set). The window shown in Choice Model Fitting Dialog had only the Choice Set grouping variable because there was a single survey and a single respondent. This example included multiple surveys and respondents, which must be included in the analysis.
|
3.
|
Click Run Model on the Fit Model window. The query again appears, asking if the analysis is a one-table analysis with all the data in the profile table. Click Yes to see the initial analysis result shown in Initial Analysis of the Final Laptop Survey.
|
You would like to know how changing the price, or other characteristics, of a laptop affects the desirability as perceived by potential buyers. This desirability is called the utility value of the laptop attributes. The profiler shows the utility value and how it changes as the laptop attributes change.
|
1.
|
Select Profiler from the menu on the Choice Model title bar to see the Prediction Profiler in Default Prediction Profiler for Laptop Choice Analysis.
|
Compare the Utility values in Default Prediction Profiler for Laptop Choice Analysis and Compare Change in Utility Over Price. The value of Utility changes from –0.3406 to –2.3303 when cost is raised from $1,000 to $1,500. That is, raising the price of a laptop $500.00 lowers the utility (or desirability) approximately 2 units. Thus, you can say that the unit utility cost is approximately $250.00.
With this unit utility cost estimate, you can now vary the other attributes, note the change in utility, and find an approximate dollar value associated with that attribute change. For example, the most significant attribute is speed (see Initial Analysis of the Final Laptop Survey).
You can see in Change Speed in Profiler and Note Utility Value that the Utility value changes from the original value shown in Default Prediction Profiler for Laptop Choice Analysis of –0.3406 to 0.9886, for a total change of 1.3292 units. If the unit utility cost is estimated to be $250.00, as shown above, then the increase in price for a 2.0 GHz laptop over a 1.5 GHz laptop can be computed to be 1.3292*$250.00 = $332.30. This is the dollar value the Choice survey provides the manufacturer as a basis for pricing different laptop products. You can make similar calculations for the other attributes.