|
1.
|
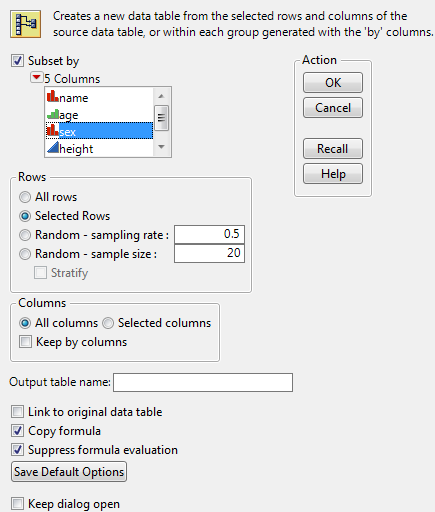
Select Tables > Subset.
|
|
3.
|
|
4.
|
Click OK to create the subset table.
|
|
To subset by the levels of a column, select Subset by and select the columns that you want to categorize for the subset.
|
|
|
To give a name to the subset table, type a name in the box beside Output table name.
|
|
|
To keep the subset table linked to the original table, click the box beside Link to original data table. When you change values in one table, the other table is updated.
|
|
|
To include formulas from the original table in the output columns, click the box beside Copy formula. Include all columns needed for the calculation of the formula.
|
|
|
To prevent JMP from evaluating columns’ formulas when the new table is created, click the box beside Suppress formula evaluation.
|
|
|
To save your current settings, select Save Default Options.
Note: Save Default Options only saves the settings for Selected Rows, Selected Columns, Linked to original data table, Copy formula, and Suppress formula evaluation.
|
|
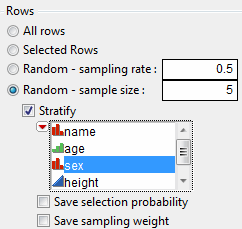
For stratified random samples with a specified sample size, two columns can be saved: Selection Probability and Sampling Weight. Check the corresponding check box to save these columns.
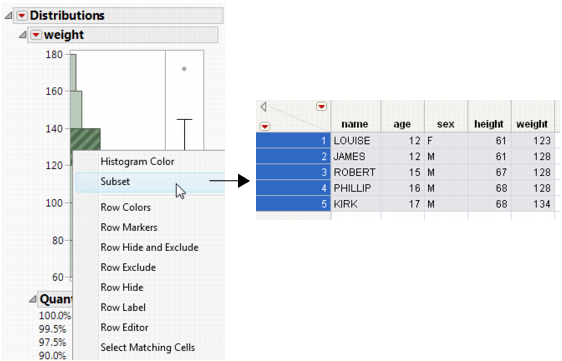
Once you have produced output that contains a histogram (by selecting Analyze > Distribution), you can use the histogram to create a new data table. The new data table contains the data in the histogram’s highlighted bars.
To create a subset, double-click a highlighted bar. Or, right-click anywhere in the histogram and select Subset from the menu. The subset table appears, as shown in Subset Created from a Histogram.
Once you have produced output that contains a Pareto Plot (by selecting Analyze > Quality and Process > Pareto Plot), you can use the Pareto Plot to create a new data table. The new data table contains the data in the Pareto Plot’s highlighted bars. To create a subset, double-click a highlighted bar.