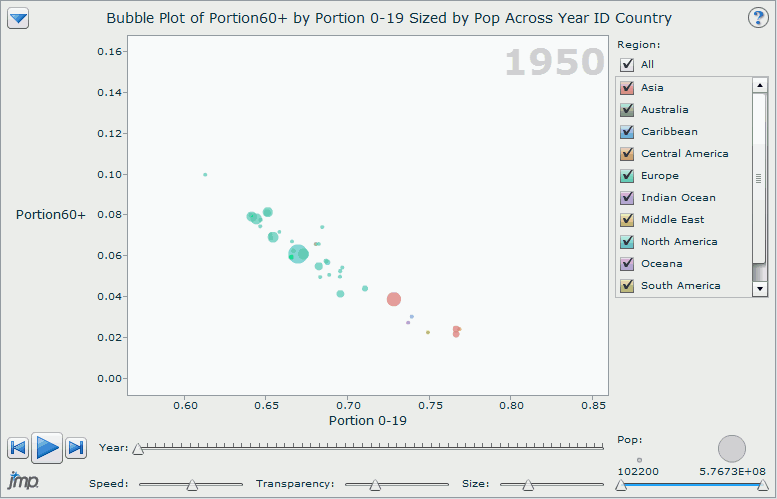
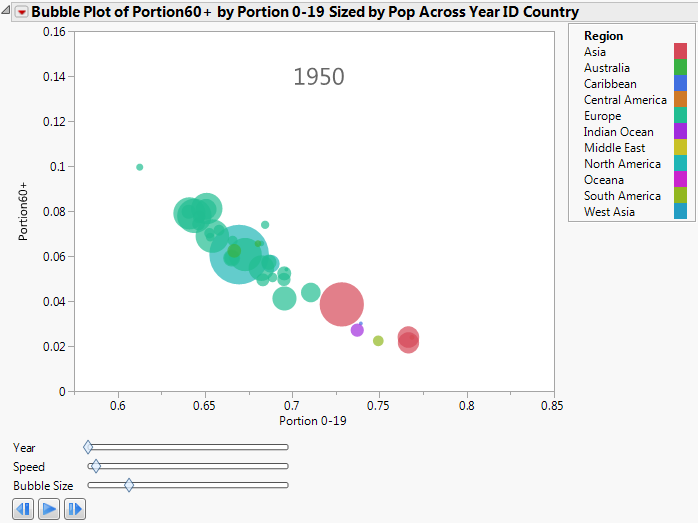
To share the interactive results of a profiler, bubble plot, or distribution outside of JMP, you can export an SWF file and use the Adobe Flash Player to view it. You can import the SWF file into presentations and applications. You can also save the results as an HTML page with the SWF output embedded.
|
1.
|
|
2.
|
|
3.
|
|
4.
|
|
5.
|
|
6.
|
|
7.
|
|
8.
|
|
9.
|
Click OK.
|
|
1.
|
|
2.
|
In the Save As SWF window, select the location to which you want to save the file.
|
|
3.
|
Click Save. The Adobe Flash version of the Bubble Plot is saved as HTML and appears in a web browser.
|