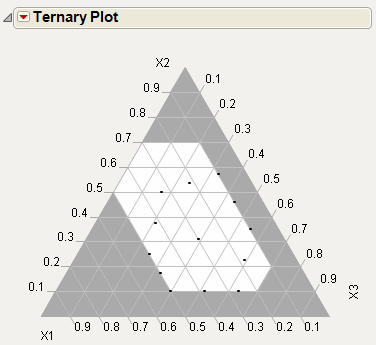
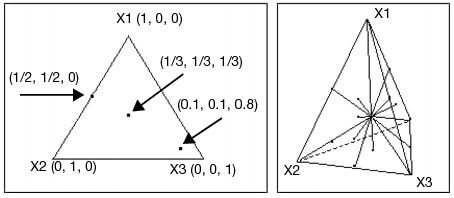
A mixture problem in three components can be represented in two dimensions because the third component is a linear function of the others. The ternary plot in Diagram of Ternary Plot Showing Piepel Example Constraints shows how close to one (1) a given component is by how close it is to the vertex of that variable in the triangle. The plot in Ternary Plot for Mixture Design illustrates a ternary plot.
The Piepel (1979) example referenced in An Extreme Vertices Example with Linear Constraints is best understood by the ternary plot shown in Diagram of Ternary Plot Showing Piepel Example Constraints.
|
1.
|
Create the Piepel mixture data as shown previously, or open the table called Piepel.jmp, found in the Design Experiments folder of the Sample Data Library.
|
|
2.
|
Choose Graph > Ternary Plot.
|