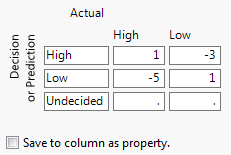
When a profit matrix is defined, the partition algorithm uses the values in the matrix to calculate the profit for each decision. The level of the response with the largest profitability is considered the final decision. When you select Save Columns > Save Prediction Formula, this decision is given in the column Most Profitable Prediction for <column name>. See Specify Profit Matrix.
Tip: To obtain decision rate matrices for a response using the default profit matrix with costs of 1 and -1, select Specify Profit Matrix from the red triangle menu, make no changes to the default values, and click OK.
|
1.
|
|
2.
|
Select Analyze > Modeling > Partition.
|
|
3.
|
|
4.
|
|
5.
|
Click OK.
|
|
6.
|
Click Split ten times.
|
|
7.
|
From the red triangle menu next to Partition for Severity, select Specify Profit Matrix.
|
|
9.
|
Click OK.
|
|
10.
|
From the red triangle menu next to Partition for Severity, select Show Fit Details.
|
|
11.
|
From the red triangle menu next to Partition for Severity, select Save Columns > Save Prediction Formula.
|
|
‒
|
The first three columns involve only the predicted probabilities. The confusion matrix counts are based on the Most Likely Severity column, which classifies a patient into the level with the highest predicted probability. These probabilities are given in the Prob(Severity == High) and Prob(Severity == Low) columns.
|
|
‒
|
The last five columns involve the profit matrix weighting. The column called Most Profitable Prediction for Severity contains the decision based on the profit matrix. The decision for a patient is the level that results in the largest profit. The profits are given in the Profit for High and Profit for Low columns.
|
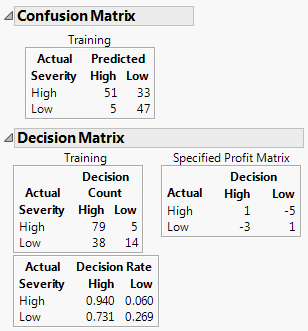
The Confusion Matrix in Confusion Matrix and Decision Matrix Reports shows classifications based on predicted probabilities alone. Based on these, 33 High severity patients would be classified as Low severity and 5 Low severity patients would be classified as High severity. The Decision Matrix report incorporates the weights in the profit matrix. Using those weights, only 5 High severity patients are classified as Low severity. However, this comes at the expense of misclassifying 38 Low severity patients into the High severity group.