This example uses a proportional hazards model for the sample data, VA Lung Cancer.jmp. The data were collected from a randomized clinical trial, where males with inoperable lung cancer were placed on either a standard or a novel (test) chemotherapy (Treatment). The primary interest of this trial was to assess if the treatment type has an effect on survival time, with special interest given to the type of tumor (Cell Type). See Prentice (1973) and Kalbfleisch and Prentice (2002) for additional details about this data set.
|
•
|
Age, Diag Time, and KPS are continuous measures and Cell Type, Treatment, and Prior are categorical (nominal) variables. The four nominal levels of Cell Type include Adeno, Large, Small, and Squamous.
|
1.
|
|
2.
|
Select Analyze > Reliability and Survival > Fit Proportional Hazards.
|
|
3.
|
|
4.
|
|
5.
|
|
6.
|
Click Run.
|
|
7.
|
From the red triangle menu, select Risk Ratios.
|
|
•
|
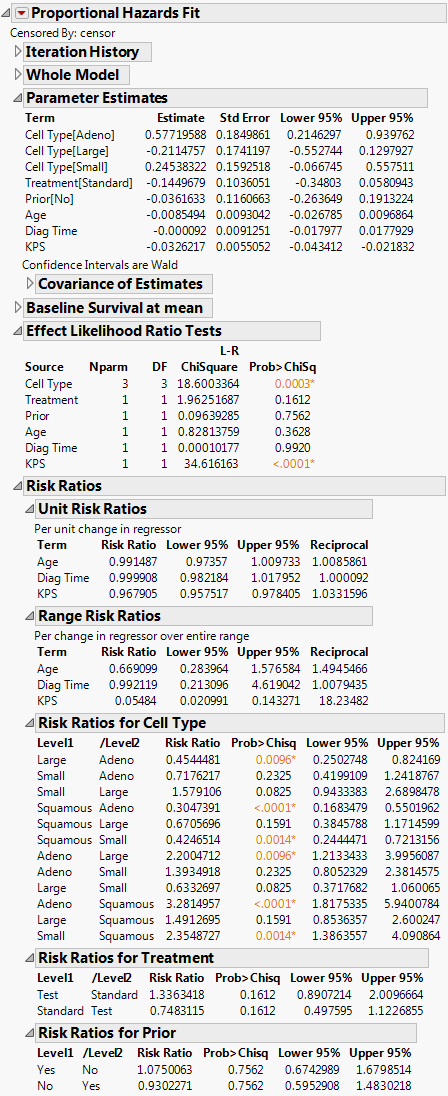
In the Effect Likelihood Ratio Tests report, the Prob>ChiSq values indicate that KPS and at least one of the levels of Cell Type are significant, while Treatment, Prior, Age, and Diag Time effects are not significant.
|
Report Window for Proportional Hazards Model with Multiple Effects and Levels shows the Risk Ratios for the continuous effects (Age, Diag Time, KPS) and the nominal effects (Cell Type, Treatment, Prior). For illustration, focus on the continuous effect, Age, and the nominal effect with four levels (Cell Type) for the VA Lung Cancer.jmp sample data.
For the continuous effect, Age, in the VA Lung Cancer.jmp sample data, the risk ratios are calculated as follows:
exp(β) = exp(-0.0085494) = 0.991487
exp[β(xmax - xmin)] = exp(-0.0085494 * 47) = 0.669099
For the nominal effect, Cell Type, all pairs of levels are calculated and are shown in the Risk Ratios for Cell Type table. Note that for a categorical variable with k levels, only k -1 design variables, or levels, are used. In the Parameter Estimates table, parameter estimates are shown for only three of the four levels for Cell Type (Adeno, Large, and Small). The Squamous level is not shown, but it is calculated as the negative sum of the other estimates. Here are two example Risk Ratios for Cell Type calculations: