|
1.
|
|
2.
|
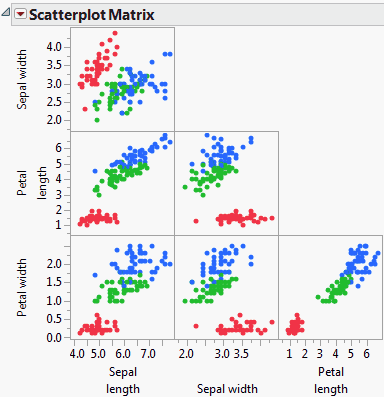
Select Graph > Scatterplot Matrix.
|
|
3.
|
|
4.
|
|
5.
|
Click OK.
|
|
6.
|
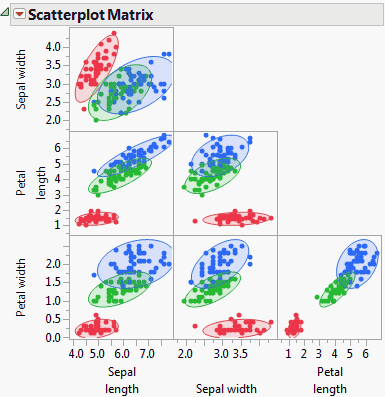
From the red triangle menu, select Density Ellipses > Density Ellipses.
|
|
7.
|
From the red triangle menu, select Density Ellipses > Shaded Ellipses.
|
If your data does not already have a grouping variable, you can create one using the Cluster platform. Using the Iris.jmp data, assume that the Species column does not exist. You know that the data comes from three species of Iris flowers, so you want to create three clusters within a group.
|
1.
|
|
2.
|
|
3.
|
Click OK.
|
|
4.
|
From the red triangle menu, select Number of Clusters.
|
|
6.
|
Click OK.
|
|
7.
|
From the red triangle menu, select Save Clusters.
|
|
8.
|
Close the Hierarchical Cluster report window, and go back to the Iris.jmp data table.
|
|
9.
|
Perform the Scatterplot Matrix analysis. Follow the instructions in the section Example Using a Grouping Variable, but use Cluster as the grouping variable.
|
