|
1.
|
|
2.
|
Select Analyze > Quality and Process > Measurement Systems Analysis.
|
|
3.
|
|
4.
|
|
5.
|
Notice that the MSA Method is set to EMP, the Chart Dispersion Type is set to Range, and the Model Type is set to Crossed. See The Measurement Systems Analysis Window.
|
6.
|
Click OK.
|
|
7.
|
From the Measurement Systems Analysis red triangle menu, select Parallelism Plots.
|
|
8.
|
Launch the Measurement Systems Analysis platform by selecting Analyze > Quality and Process > Measurement Systems Analysis.
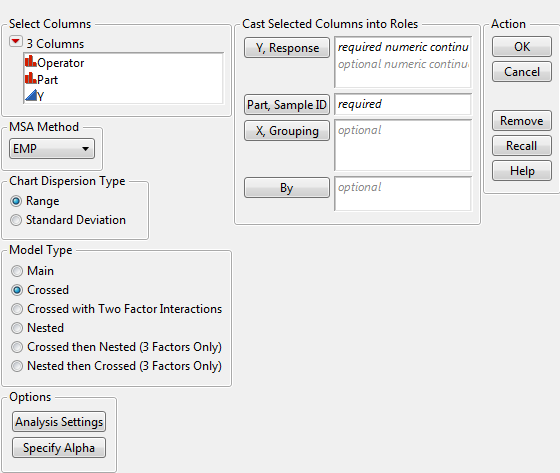
select the method to use: EMP (Evaluating the Measurement Process) or Gauge R&R. This chapter covers the EMP method. For details about the Gauge R&R method, see the Variability Gauge Charts section.
designates the type of chart for showing variation. Select the Range option or the Standard Deviation option.
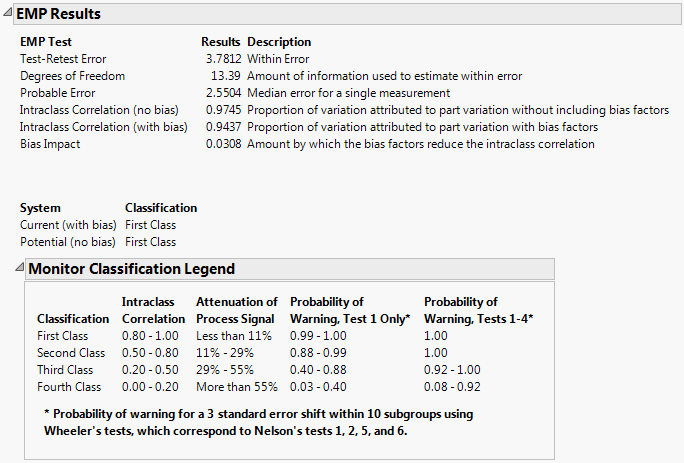
Note: For the EMP method, the chart dispersion type determines how the statistics in the EMP Results report are calculated. If the Range option is selected, and you have a one factor or a two factor, balanced, crossed model, the statistics in this report are based on ranges. Otherwise, the statistics in this report are based on standard deviations.
|
‒
|
Analysis Settings sets the REML maximum iterations and convergence.
|
|
‒
|
Specify Alpha specifies the 1-alpha confidence level.
|