The Boston Housing.jmp sample data table contains data on the price of homes in Boston area communities, along with demographic information. The Partition platform can be used to model the home values.
|
1.
|
Open the Boston Housing.jmp sample data table.
|
|
2.
|
|
3.
|
|
4.
|
|
5.
|
|
|
6.
|
Enter 0.2 for the Validation Portion.
|
|
7.
|
Click OK.
|
|
8.
|
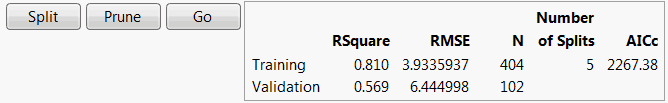
On the platform report window, click Go to perform automatic splitting.
|
The fit statistics are shown in Fit Statistics for Boston Housing Data. Automatic splitting resulted in five splits. The final RSquare for the Validation set is 0.569.
Note: Because you are using a random Validation Portion, your results differ from those in Fit Statistics for Boston Housing Data.
|
9.
|
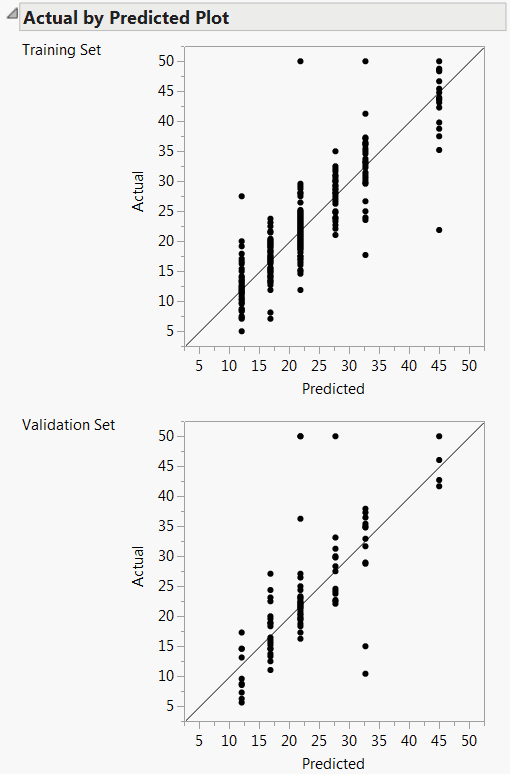
Select Plot Actual by Predicted from the platform red-triangle menu.
|
A portion of the report is shown in Decision Tree Results. Because there are five splits, the tree has six leaves. Therefore, there are six distinct predicted values.
|
10.
|
Select Column Contributions from the report’s red triangle menu.
|
The report (Column Contributions) shows that the predictors that contribute the most to the model are rooms and lstat.
|
11.
|
From the report’s red triangle menu, select Save Columns > Save Prediction Formula.
|
This saves your prediction formula to the data table in a column called mvalue Predictor.
See Examples of Bootstrap Forest, Boosted Tree, and Model Comparison for a continuation of this example.