To create a contour plot, you need two variables for the x- and y-axes and at least one more variable for contours. You can also use several y-variables. This example uses the Little Pond.jmp sample data table. X and Y are coordinates of a pond. Z is the depth.
|
1.
|
|
2.
|
Select Graph > Contour Plot.
|
|
3.
|
|
4.
|
|
5.
|
Click Specify.
|
|
6.
|
In the Contour Specification window, select # of Contours as 7.
|
|
7.
|
Select Minimum as -4.
|
|
8.
|
Select Maximum as 8.
|
|
9.
|
Click OK.
|
|
10.
|
Click OK.
|
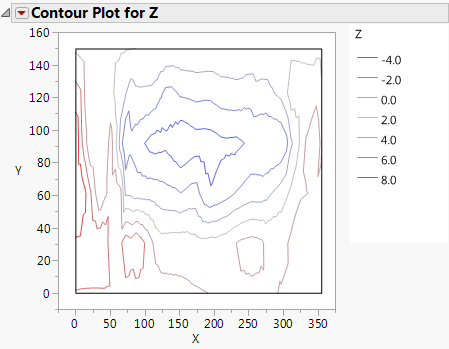
The x- and y-axes are coordinates and the contour lines are defined by the depth variable. This contour plot is essentially a map of a pond showing depth. To see the contours more clearly, click the red triangle menu and select Fill Areas.