This example uses the Boston Housing.jmp data table. Suppose you want to create a model to predict the median home value as a function of several demographic characteristics. Follow the steps below to build the neural network model:
|
1.
|
|
2.
|
|
3.
|
|
4.
|
Click OK.
|
|
7.
|
Check the Transform Covariates option.
|
|
8.
|
Click Go.
|
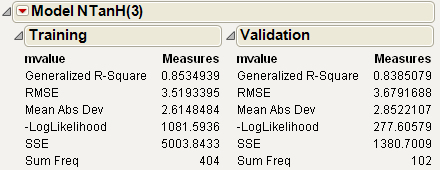
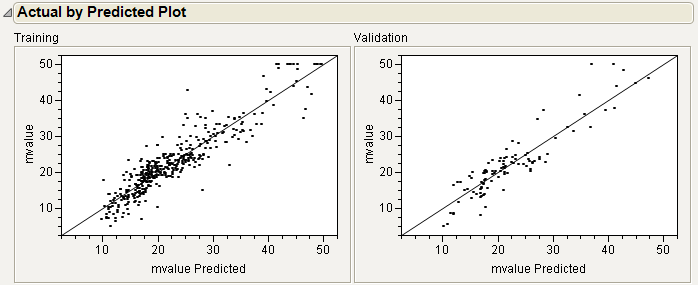
The R-Square statistic for the Validation set is 0.838, signifying that the model is predicting well on data not used to train the model. As an additional assessment of model fit, select Plot Actual by Predicted from the Model red-triangle menu. The plot is shown in Actual by Predicted Plot.
To get a general understanding of how the X variables are impacting the predicted values, select Profiler from the Model red-triangle menu. The profiler is shown in Profiler.
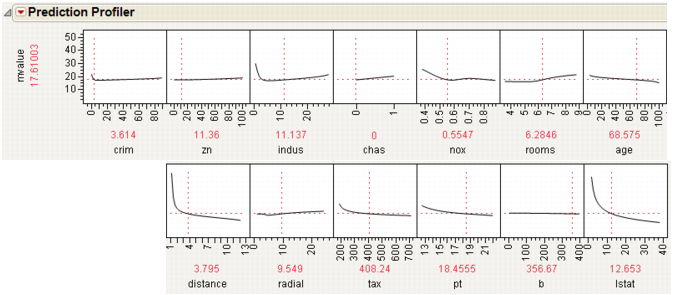
Some of the variables have profiles with positive slopes, and some negative. For example, rooms has a positive slope. This indicates that the more rooms a home has, the higher the predicted median value. The variable age is the proportion of owner-occupied units built prior to 1940. This variable has a negative slope, indicating that the more older homes there are in the area, the lower the median value.