This example uses the Dogs.jmp sample data table, which contains histamine level measurements for 16 dogs that were given two different drugs. The histamine levels were taken at zero, one, three, and five minutes. Examine the variation in the histamine levels for each drug.
|
1.
|
|
2.
|
Select Rows > Color or Mark by Column.
|
|
3.
|
|
4.
|
Select Graph > Parallel Plot.
|
|
5.
|
|
6.
|
Click OK.
|
|
7.
|
Select Rows > Data Filter.
|
|
8.
|
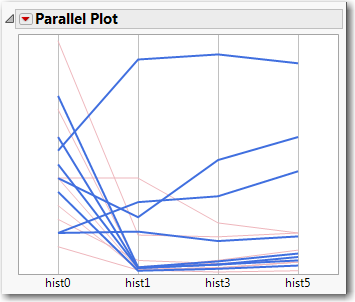
From Trimeth Values Highlighted, you observe the following about the histamine levels for dogs given trimeth: