This example uses three data tables: Pizza Profiles.jmp, Pizza Responses.jmp, and Pizza Subjects.jmp.
|
1.
|
Select Help > Sample Data Library and open Pizza Profiles.jmp, Pizza Responses.jmp, and Pizza Subjects.jmp.
|
The profile data table, Pizza Profiles.jmp, lists all the pizza choice combinations that you want to present to the subjects. Each choice combination is given an ID.
For the actual survey or experiment, each subject is given four trials, where each trial consists of stating his or her preference between two choice profiles (Choice1 and Choice2). The choice profiles given for each trial are referred to as a choice set. One subject’s choice trials can be different from another subject’s trials. Refer to the Discrete Choice Designs chapter in the Design of Experiments Guide. Notice that each choice value refers to an ID value in the Profile data table that has the attribute information.
Data about the subjects are stored in a separate Pizza Subjects.jmp file. This table includes a Subject ID column and characteristics of the subject. In the pizza example, the only characteristic or attribute about the Subject is Gender. Notice that the response choices and choice sets in the response data table use the ID names given in the Pizza Profiles.jmp data set. Similarly, the subject identifications in the response data table match those in the subject data table.
|
2.
|
|
3.
|
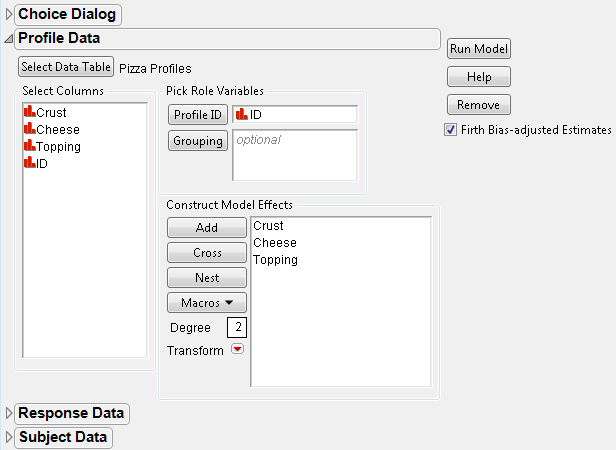
Select Select Data Table under Profile Data.
|
|
4.
|
Select Pizza Profiles.jmp.
|
The columns from this table now populate the field under Select Columns in the Choice Dialog box.
|
5.
|
Select ID for Profile ID under Pick Role Variables and Add Crust, Cheese, and Topping under Construct Model Effects.
|
|
6.
|
Open the Response Data section of the window. Click Select Data Table. When the Response Data Table window appears, select Pizza Responses.jmp.
|
|
7.
|
Select Choice for the Profile ID Chosen, and Choice1 and Choice2 for the Profile ID Choices. Select Subject for the Subject ID.
|
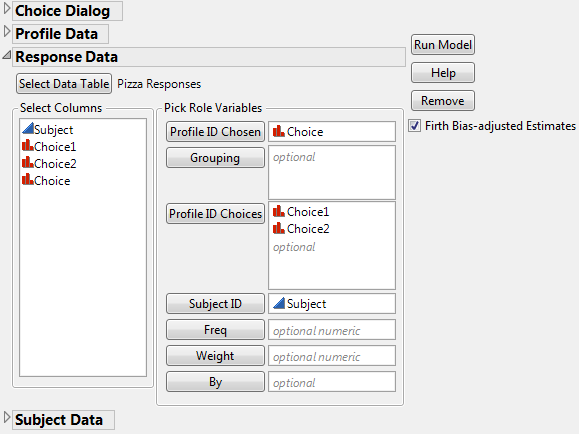
Choice1 and Choice2 are the profile ID choices given to a subject on each of four trials. The Choice column contains the chosen preference between Choice1 and Choice2.
|
8.
|
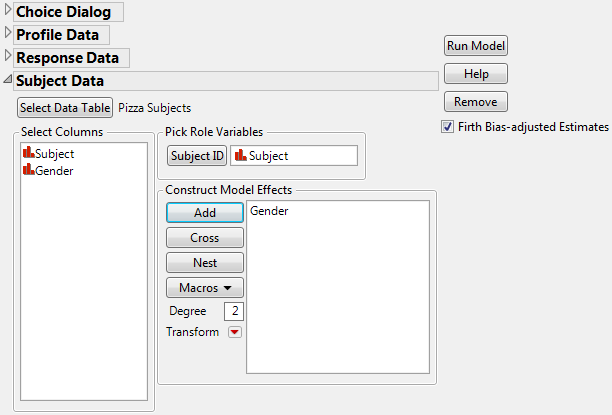
Open the Subject Data section of the window. Click Select Data Table. When the Subject Data Table window appears, select Pizza Subjects.jmp.
|
|
9.
|
|
10.
|
|
11.
|
Click Run Model.
|
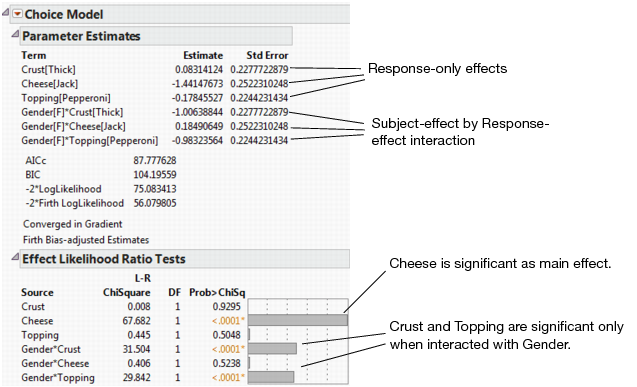
Choice Model Results shows the parameter estimates and the likelihood ratio tests for the Choice Model with subject effects included. Strong interactions are seen between Gender and Crust and between Gender and Topping. When the Crust and Topping factors are assessed for the entire population, the effects are not significant. However, the effects of Crust and Topping are strong when they are evaluated between Gender groups.
|
1.
|
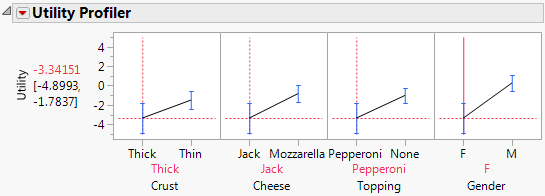
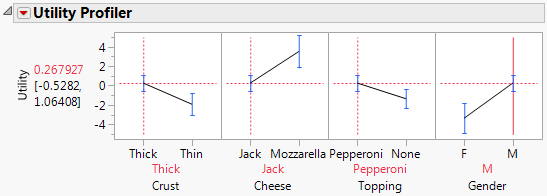
From the Choice Model red triangle menu, select Utility Profiler.
|
|
2.
|
Move the red line in the Gender plot to male (M).
|
|
3.
|
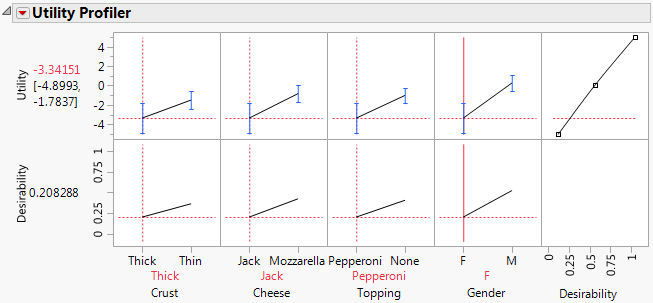
Click the red triangle menu of the Utility Profiler and select Desirability Functions.
|
A new row is added to the Utility Profiler, displaying overall desirability traces and measures. Utility and Desirability Functions are shown together in Utility and Desirability Functions.
|
4.
|
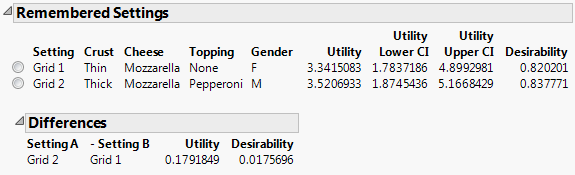
From the red triangle menu of the Utility Profiler, select Maximize for each Grid Point.
|
A Remembered Settings table containing the grid settings with the maximum utility and desirability functions, and a table of differences between grids is displayed. See Utility and Desirability Settings. As illustrated, this feature can be a very quick and useful tool for selecting the most desirable attribute combinations for a factor.