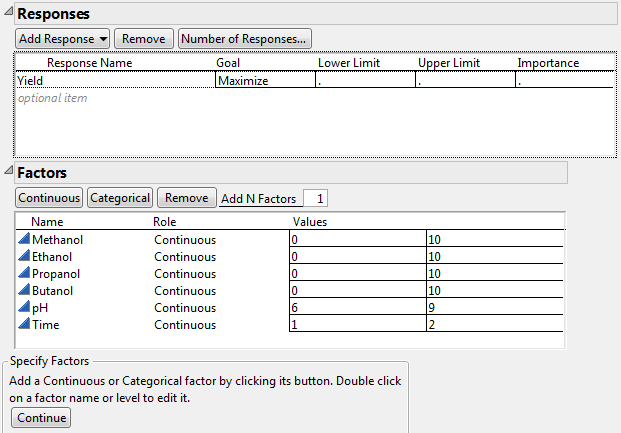
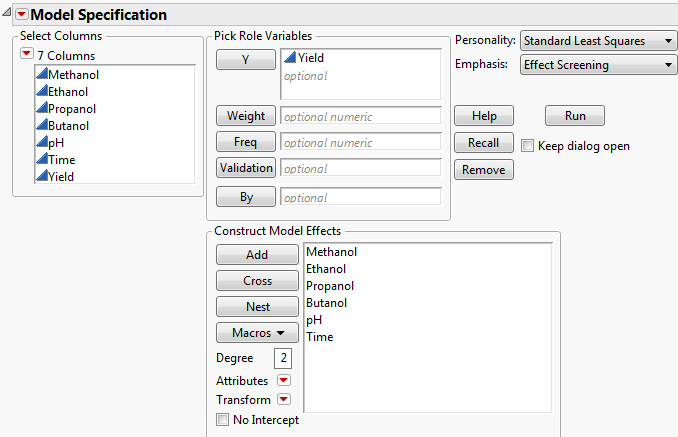
The factors and their settings are given in the data table Extraction Factors.jmp. You create a definitive screening design to investigate.
|
1.
|
Select DOE > Definitive Screening Design.
|
|
2.
|
|
3.
|
From the red triangle menu, select Load Factors.
|
|
4.
|
|
5.
|
Click Continue.
|
The Orthogonal Blocking Options outline opens. Here you can specify a blocking structure. There is no need to block in this example, so you accept the default selection of No Blocks Required.
Note: Setting the Random Seed in step 6 reproduces the exact results shown in this example. In constructing a design on your own, this step is not necessary.
|
6.
|
(Optional) From the Definitive Screening Design red triangle menu, select Set Random Seed, type 123, and click OK.
|
|
7.
|
Click Make Design.
|
|
8.
|
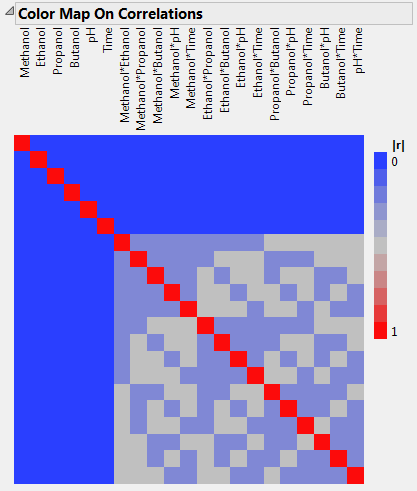
Open the Design Evaluation > Color Map on Correlations outline.
|
|
9.
|
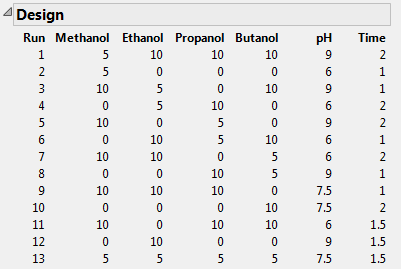
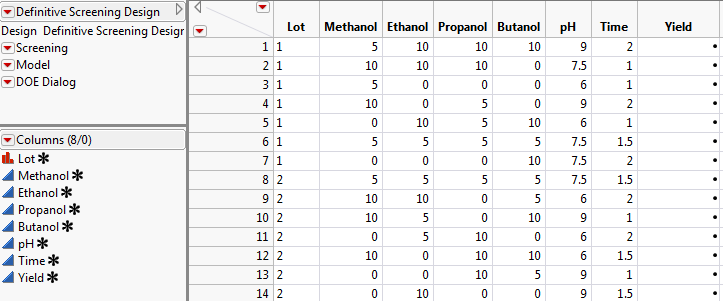
In the Output Options panel, note that the Run Order is set to Randomize. Click Make Table to obtain the data table shown in Definitive Screening Design for Extraction Process.
|
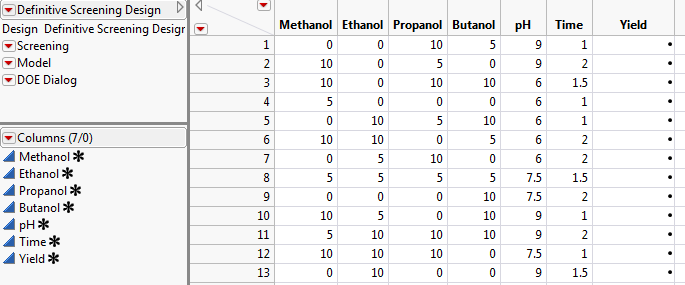
Now, conduct your experiment and record your data in the Yield column of the generated data table (Definitive Screening Design for Extraction Process). The Extraction Data.jmp sample data table contains your experimental results.
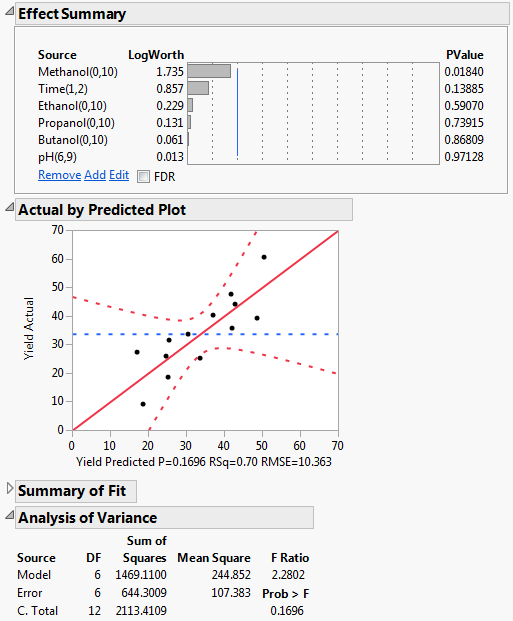
A main effects model fails to show overall significance. Only one effect, Methanol, is identified as active. To see this, follow these steps:
|
1.
|
|
2.
|
|
3.
|
Click Run.
|
|
‒
|
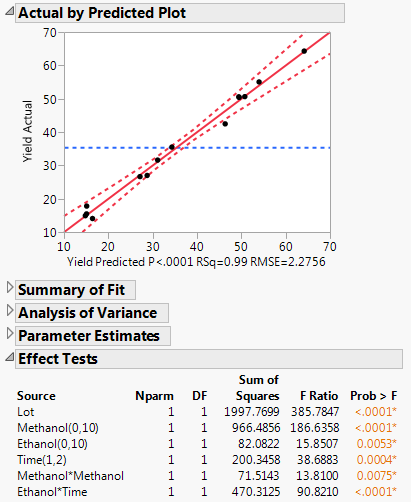
The Effect Summary report shows that Methanol is the only significant effect, with a p-value of 0.01840.
|
|
1.
|
In the Tables panel of the Extraction Data.jmp sample data table, click the red triangle next to Model and select Run Script.
|
|
2.
|
|
3.
|
Select Macros > Response Surface.
|
|
4.
|
|
5.
|
|
6.
|
Click Go.
|
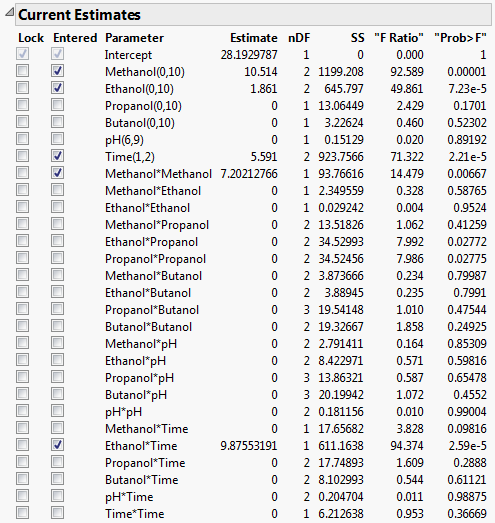
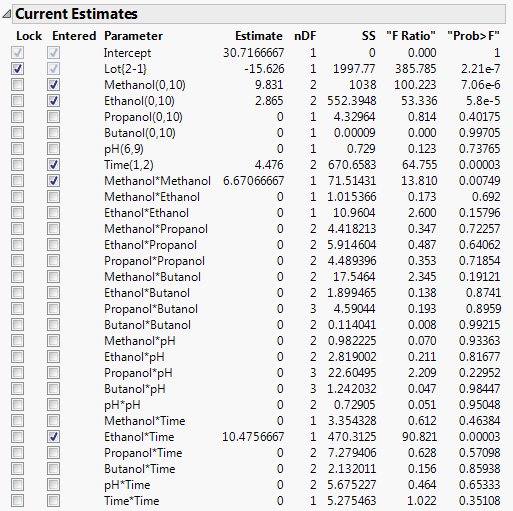
Stepwise identifies a model consisting of three main effects, a quadratic effect, and an interaction effect: Methanol, Ethanol, Time, Methanol*Methanol, and Ethanol*Time.
|
7.
|
Click Make Model in the upper right of the Stepwise Regression Control report.
|
|
‒
|
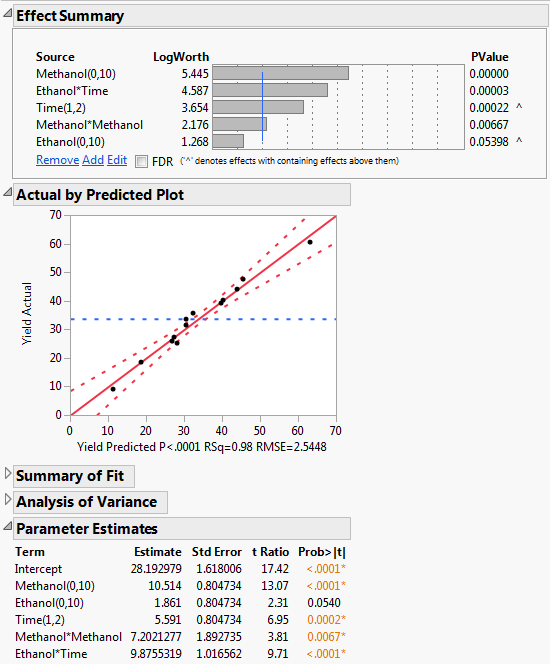
The Effect Summary report shows that all effects other than Ethanol are significant at the 0.05 level. Ethanol is nearly significant at the 0.05 level and it is a component of the Ethanol*Time interaction, which is significant. Consequently, you retain Ethanol as a model effect.
|
If you had used an ordinary screening design with center runs, the nonlinearity could have been detected. However, further runs would have been necessary to identify Methanol as the source of the quadratic effect.
Suppose that you had chosen a traditional screening design instead of the definitive screening design in Definitive Screening Design. This example shows you how to compare the two designs.
|
1.
|
Select DOE > Screening Design.
|
|
2.
|
|
3.
|
Select Load Factors From the red triangle next to Definitive Screening Design.
|
|
4.
|
|
5.
|
Click Continue.
|
|
6.
|
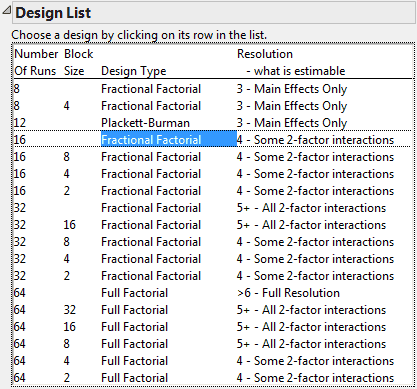
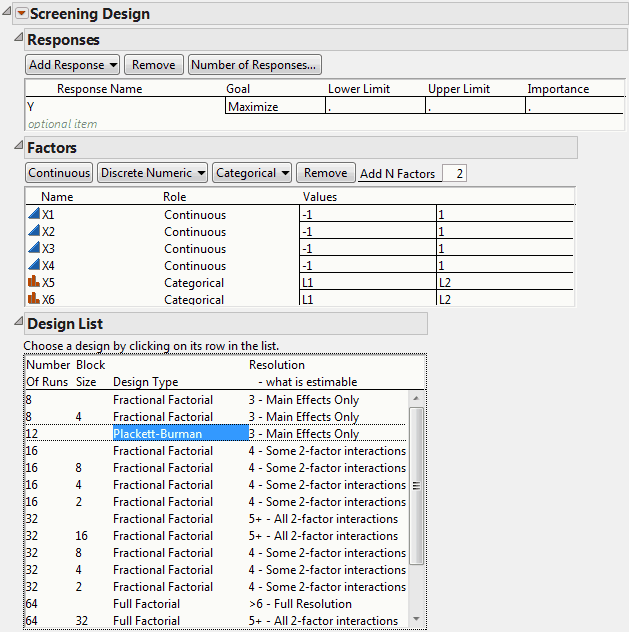
Select Choose from a list of fractional factorial designs.
|
|
7.
|
Click Continue.
|
|
8.
|
|
9.
|
Click Continue.
|
|
10.
|
Open the Design Evaluation > Aliasing of Effects outline.
|
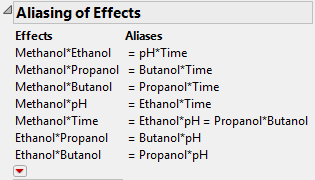
The Aliasing of Effects outline for the 16-run fractional factorial design shows that every two-factor interaction is confounded with at least one other two-factor interaction. In this fractional factorial design, the Ethanol*Time interaction is confounded with Methanol*pH. To determine which interaction is active, you need to run additional trials. Had the factors been entered in a different order, the Ethanol*Time interaction might have been aliased with two other two-factor interactions.
In the section Definitive Screening Design, you constructed a 13-run definitive screening design. When you analyzed the experimental results for this 13-run design, the Ethanol*Time interaction was found to be active. See Model Specifying Main and All Second Order Effects.
Using the13-run definitive screening design, you also determined that the quadratic effect Methanol*Methanol was likely to be active. For the 16-run fractional factorial design, this quadratic effect cannot even be estimated. This is because the settings for each factor are at either the low or the high value. If you add center points, you might be able to detect curvature. But you will not be able to determine which factor is responsible without further runs.
The extraction factors and their settings are given in the data table Extraction Factors.jmp. Generate a definitive screening design with a block as follows.
|
1.
|
Select DOE > Definitive Screening Design.
|
|
2.
|
|
3.
|
From the red triangle menu, select Load Factors.
|
|
4.
|
|
5.
|
Click Continue.
|
|
6.
|
Select Add Blocks with Center Runs to Estimate Quadratic Effects.
|
Leave Number of Blocks set at 2.
Note: Setting the Random Seed in step 7 reproduces the exact run order shown in this example. In constructing a design on your own, this step is not necessary.
|
7.
|
(Optional) From the Custom Design red triangle menu, select Set Random Seed, type 123, and click OK.
|
|
8.
|
Click Make Design.
|
Check that Block has been added to the Factors outline and to the Design.
|
9.
|
|
10.
|
In the Output Options panel, note that the Run Order is set to Randomize within Blocks. Click Make Table to obtain the data table shown in Definitive Screening Design with Block for Extraction Process.
|
At this point, you conduct your experiment and record your data in the Yield column of the design table (Definitive Screening Design with Block for Extraction Process). The Extraction2 Data.jmp sample data table contains your experimental results.
|
1.
|
|
2.
|
In the Tables panel of the design table, click the red triangle next to Model and select Run Script.
|
|
3.
|
|
4.
|
Select Macros > Response Surface.
|
|
5.
|
|
6.
|
Click Run.
|
|
7.
|
|
8.
|
In the Entered column in the Current Estimates outline, check the box next to Lot(2-1).
|
Recall that Lot is a blocking variable. Its purpose is to account for nuisance variation so that you can more clearly see the effects of other factors. For this reason, you want Lot to be part of all models considered by Stepwise. In the next step, you lock the Lot(1-2) term so that it remains in all models fit by Stepwise.
|
9.
|
In the Lock column in the Current Estimates outline, check the box next to Lot(2-1).
|
|
10.
|
Click Go.
|
The Current Estimates report (Current Estimates Report for Stepwise Fit) shows that Stepwise selects a model consisting of the blocking variable, three main effects, a quadratic effect, and an interaction: Lot, Methanol, Ethanol, Time, Methanol*Methanol, and Ethanol*Time.
|
11.
|
Click Make Model in the upper right of the Stepwise Regression Control report.
|
|
‒
|
The Effect Tests report also shows that Lot has the largest Sum of Squares among the model effects. Had it not been included in the model, other effects would not appear significant.
|
|
1.
|
Select DOE > Definitive Screening Design.
|
|
2.
|
|
3.
|
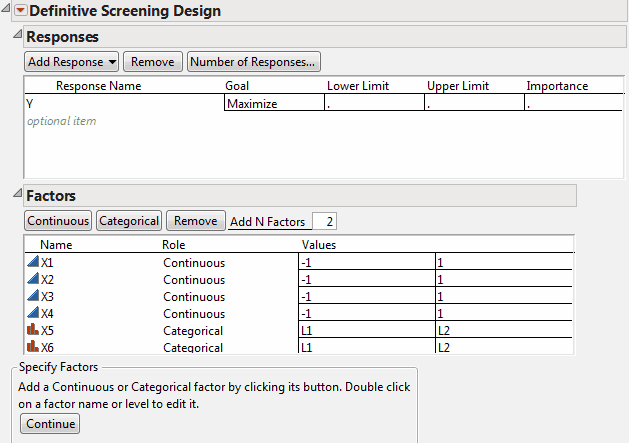
Your window should appear as shown in Definitive Screening Dialog with 4 Continuous and 2 Categorical Factors.
|
4.
|
Click Continue.
|
|
5.
|
Click Make Design.
|
|
6.
|
Open the Design Evaluation > Color Map On Correlations outline.
|
|
1.
|
Select DOE > Screening Design.
|
|
2.
|
|
3.
|
|
4.
|
Click Continue.
|
|
5.
|
|
7.
|
Click Continue.
|
|
8.
|
Open the Design Evaluation > Color Map On Correlations outline.
|
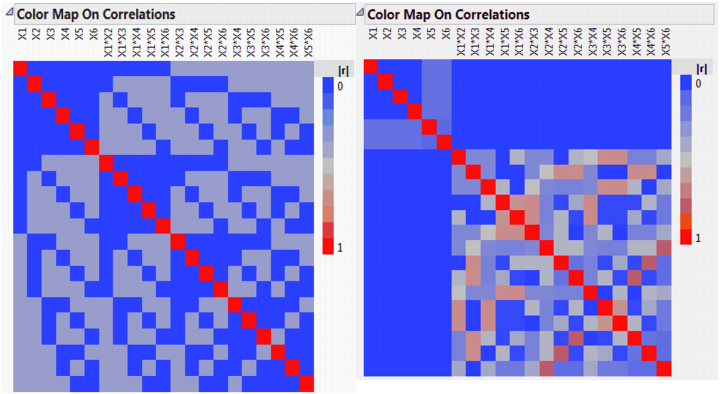
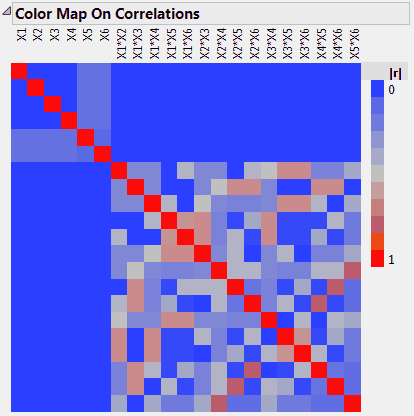
Plackett-Burman Correlations (left) and Definitive Screening Correlations (right) shows both color maps, but only shows the portion of the Plackett-Burman color map that involves main effects and two-way interactions. See Color Map on Correlations in Evaluate Designs for details about how to construct a color map for only main effects and two-way interactions.