Fit Curve Model Formulas provides the formulas for the models on the Fit Curve red triangle menu.
 |
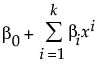 where k is the order of the polynomial. These models can also be fit using the Fit Model and Fit Y by X platforms.
|
 |
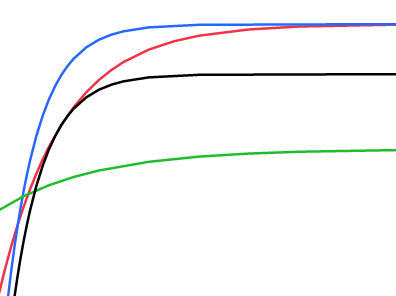
a = Growth Rate
b = Inflection Point
|
 |
a = Growth Rate
b = Inflection Point
c = Asymptote
|
 |
a = Growth Rate
b = Inflection Point
c = Lower Asymptote
d = Upper Asymptote
|
 |
a = Growth Rate
b = Inflection Point
c = Asymptote 1
d = Asymptote 2
f = Power
|
 |
a = Asymptote
b = Growth Rate
c = Inflection Point
|
 |
a = Lower Asymptote
b = Upper Asymptote
c = Growth Rate
d = Inflection Point
|
 |
a = Scale
b = Growth Rate
|
 |
a = Asymptote
b = Scale
c = Growth Rate
|
 |
a = Scale 1
b = Decay Rate 1
c = Scale 2
d = Decay Rate 2
|
 |
a = Asymptote
b = Scale 1
c = Decay Rate 1
d = Scale 2
f = Decay Rate 2
|
 |
a = Asymptote
b = Scale
c = Growth Rate
|
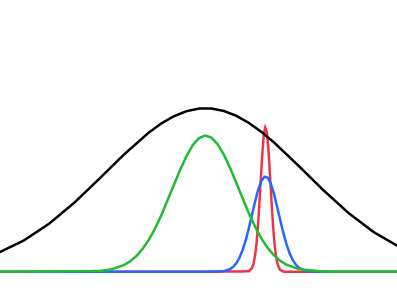 |
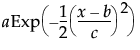 a = Peak Value
b = Critical Point
c = Growth Rate
|
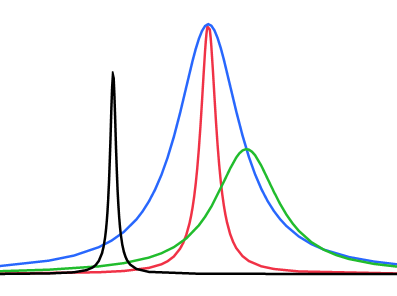 |
 a = Peak Value
b = Growth Rate
c = Critical Point
|
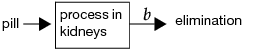 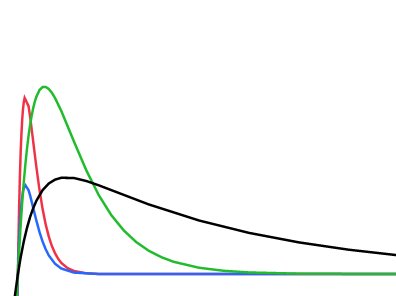 |
a = Area Under Curve
b = Elimination Rate
c = Absorption Rate
|
  |
α =
β =
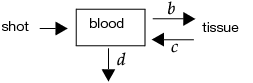
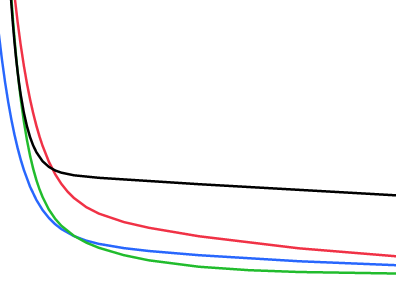
a = Initial Concentration
b = Transfer Rate In
c = Transfer Rate Out
d = Elimination Rate
|
 |
a = Max Reaction Rate
b = Inverse Affinity
|
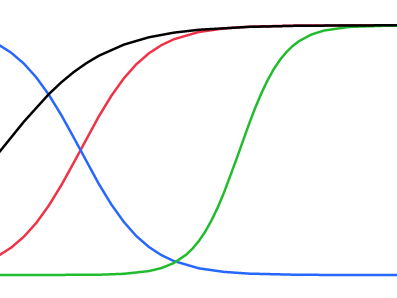
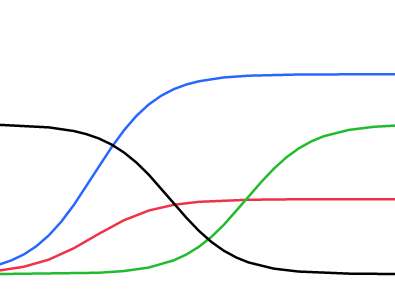
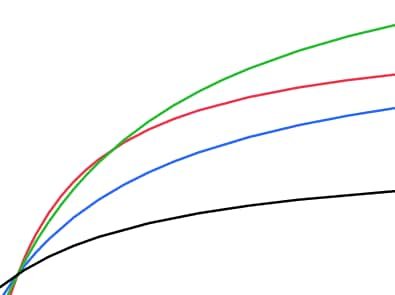
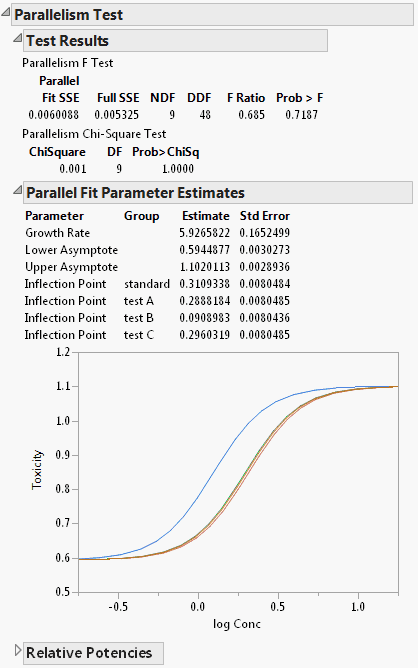
The Test Parallelism option provides an analysis for testing if the fitted models between groups have the same shape, but are shifted along the X-axis (Parallelism Test). In the Bioassay example, the curve for drug formulation B is shifted to the left of the other three curves. However, you do not know whether the curves still have the same shape (are parallel), or if formulation B is different. The Parallelism Test tells us if the shapes for the different drug formulations have similar shapes and are shifted along the horizontal axis. Select Test Parallelism from the fitted model’s red triangle menu to add the report.
Gives the relative potency for each level of the grouping variable. The relative potency is 10^(EC50), where EC50 is the concentration at which the response half way between baseline and maximum is obtained. For the Logistic 2P, 3P, and 4P, the relative potency is 10^(inflection point parameter).
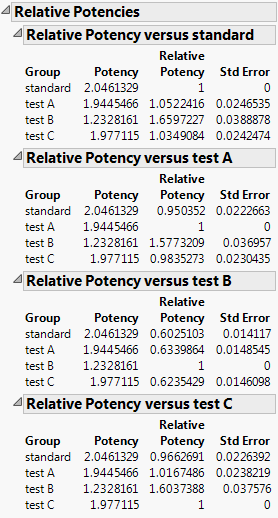
In the Relative Potency versus standard panel from Relative Potencies by group, note that the relative potencies for drug formulations A and C are nearly one. This indicates that their potencies are similar to that of the standard formulation. The potency for drug formulation B is lower than that of the standard. This means that drug formulation B increases in toxicity as a function of concentration faster than the standard.
The Compare Parameter Estimates report gives results for testing the equality of parameters across the levels of the grouping variable. There is an Analysis of Means (ANOM) report for each parameter, which tests whether the parameters are equal to an overall mean. If the result for a parameter exceeds the decision limits, then the parameter is different from the overall mean. Parameter Comparison for Growth Rate Estimates shows the ANOM report for growth rate estimates. Select Compare Parameter Estimates from the fitted model’s red triangle menu to add the report.
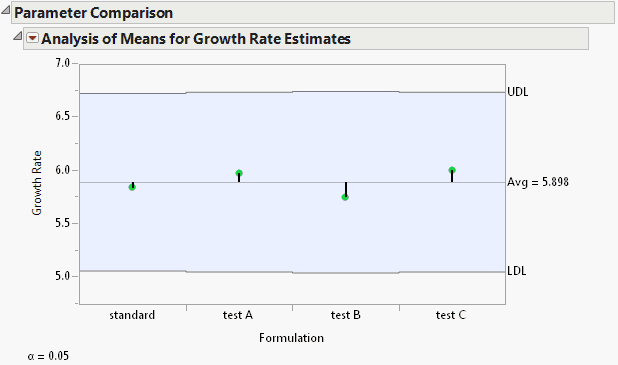
For more information about the Analysis of Means report, see the Basic Analysis book.
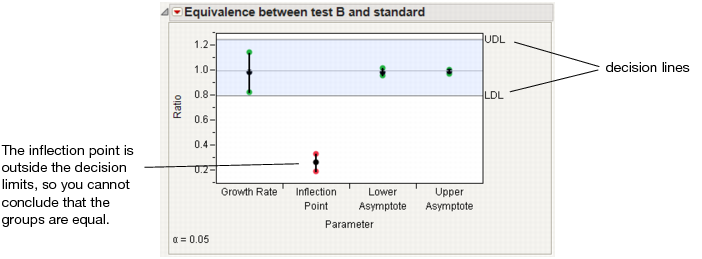
The Equivalence Test report gives an analysis for testing the equivalence of models across levels of the grouping variable (Equivalence Test). After selecting the option, you specify the level of the grouping variable that you want to test against every other level. There is a report for every level versus the chosen level. Select Equivalence Test from the fitted model’s red triangle menu to add the report.
If all of the confidence intervals are inside the decision lines, then the two groups are practically equal. If a single interval falls outside the lines (as shown in Equivalence Test), then you cannot conclude that the groups are equal. The inflection point for drug formulation B is lower than the standard, which agrees with the previous findings.