|
•
|
To open a data table, double-click on the file, or use the File > Open command.
|
This chapter uses sample data tables and sample import data that is installed with JMP. To find these files, see Using Sample Data in Introducing JMP.
|
1.
|
Open the VA Lung Cancer.xls file in Excel. This file is located in the Sample Import Data folder.
|
|
2.
|
|
4.
|
In JMP, select File > New > Data Table to create an empty table.
|
|
5.
|
Select Edit > Paste with Column Names to paste the data and column headings.
|
If the data that you are pasting into JMP does not have column names, then you can use Edit > Paste.
|
1.
|
Select File > Open.
|
|
3.
|
|
4.
|
Click Open.
|
|
1.
|
Select File > Open.
|
|
2.
|
Navigate to the Samples/Import Data folder.
|
|
3.
|
Select Team Results.xls.
|
|
4.
|
Click Open.
|
|
5.
|
Next to Column headers start on row, type 3, and press Enter. The column headings are updated in the data preview. The value for the first row of data is updated to 4.
|
|
‒
|
Deselect Use for all worksheets in the lower left corner of the window.
|
|
‒
|
Select Ungrouped Team Results in the upper right corner of the window.
|
|
7.
|
Click Import to convert the spreadsheet as you specified.
|
One way to import a text file is to let JMP assume the data’s format and place the data in a data table. This method uses settings that you can specify in Preferences. See Using JMP for information about setting text import preferences.
|
1.
|
Select File > Open.
|
|
2.
|
Navigate to the Samples/Import Data folder.
|
|
3.
|
Select Animals_line3.txt.
|
|
4.
|
At the bottom of the Open window, select Data with Preview.
|
|
5.
|
Click Open.
|
|
6.
|
Enter 3 in the File contains column names on line field.
|
|
7.
|
Enter 4 in the Data starts on line field.
|
|
8.
|
Click Next.
|
|
9.
|
Click Import.
|
The new data table has columns named species, subject, miles, and season. The species and season columns are character data. The subject and miles columns are continuous numeric data.
|
1.
|
In Excel, select JMP > Preferences.
|
|
2.
|
Accept the default Data Table Name (File name_Worksheet name) or type a name.
|
|
3.
|
Select to Use the first rows as column names if the first row in the worksheet contains column headers.
|
|
5.
|
Select to Transfer Hidden Rows if the worksheet contains hidden rows to be included in the JMP data table.
|
|
6.
|
Select to Transfer Hidden Column if the worksheet contains hidden columns to be included in the JMP data table.
|
|
7.
|
Click OK to save your preferences.
|
|
3.
|
Select JMP and then select the JMP destination:
|
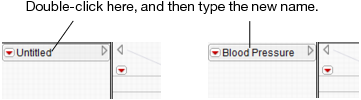
Blood Pressure Data shows the data from a study that investigated a new blood pressure medication. Each individual’s blood pressure was measured over a six-month period. Two doses (300mg and 450mg) of the medication were used, along with a control and placebo group. The data shows the average blood pressure for each group.
|
1.
|
Select File > New > Data Table to create an empty data table.
|
Note: To rename a column, you can also double-click the column name or select the column and press Enter.
|
3.
|
Select Rows > Add Rows.
|
|
5.
|
Click OK. Six empty rows are added to the data table.
|
|
6.
|
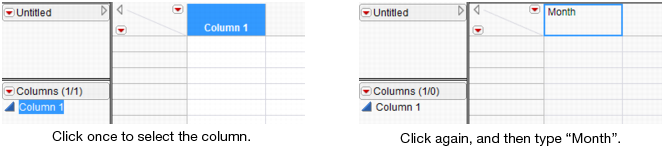
Enter the Month information by double-clicking in a cell and typing.
|
Month Column Completed
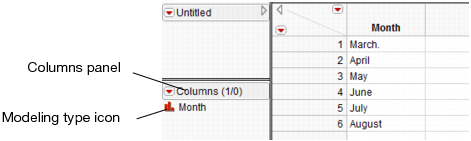
In the columns panel, look at the modeling type icon to the left of the column name. It has changed to reflect that Month is now nominal (previously it was continuous). Compare the modeling type shown for Column 1 in Entering a Column Name and for Month in Month Column Completed. This difference is important and is discussed in Viewing or Changing Column Information.
|
7.
|
|
8.
|
Change the name to Control.
|
|
9.
|
Enter the Control data as shown in Blood Pressure Data. Your data table now consists of six rows and two columns.
|
|
10.
|
Continue adding columns and entering data as shown in Blood Pressure Data to create the final data table with six rows and five columns.
|