For detailed information about JMP reports, go to https://www.jmp.com/support/help/en/15.2/jmp/jmp-reports.shtml.
Figure 1.1 See a Data Point’s Values
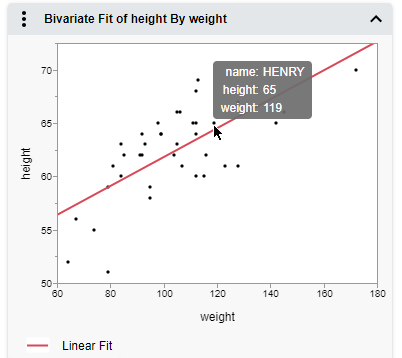
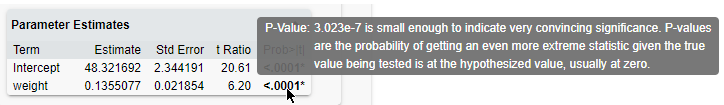
Figure 1.2 See an Explanation of a P-Value Calculation
 then tap a data point.
 then tap multiple data points.
 then tap a data point.
 then draw a rectangle over the data points. Drag the center to move the rectangle, or drag the corners to resize it.
Figure 1.3 Select Data in Linked Graphs
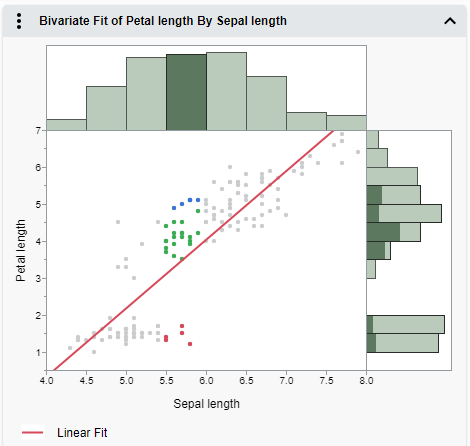
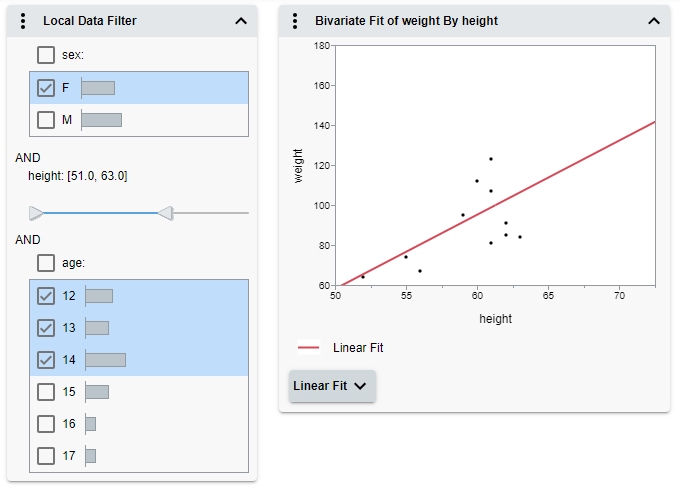
Figure 1.4 Filter Data in Graphs
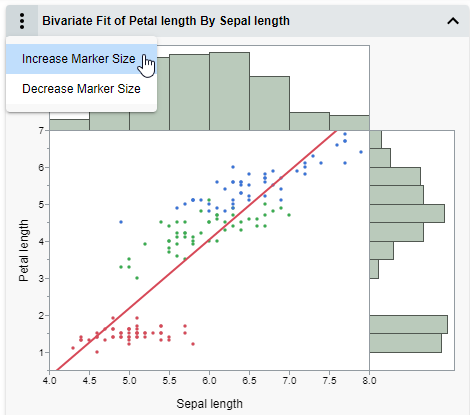
 menu next to a report to customize graph elements.
Figure 1.5 Change the Marker Size
 >
>
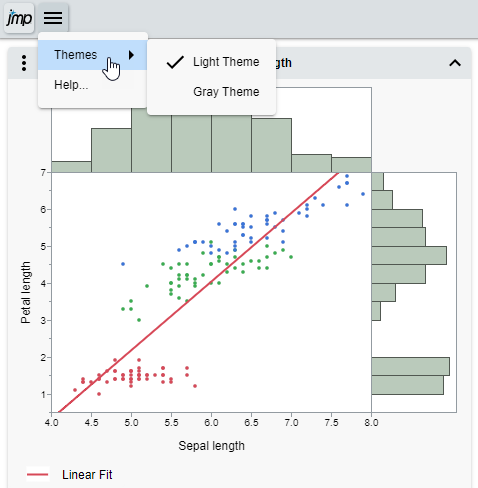
Figure 1.6 Change the Page Theme