|
•
|
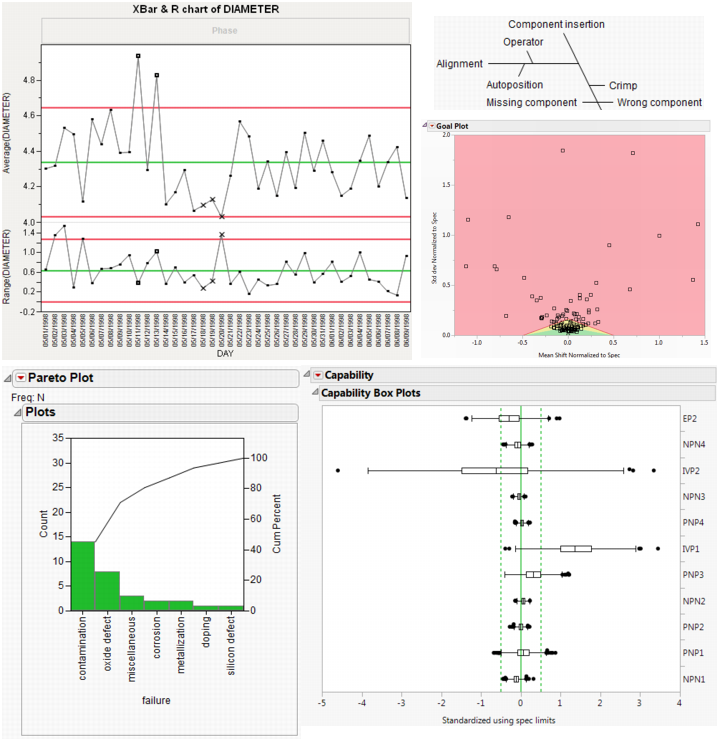
Control charts provide feedback on key variables and show when a process is in, or out of, statistical control. Chapter 3, “Control Chart Builder” and Chapter 4, “Shewhart Control Charts” describe the JMP approach to creating control charts, including an interactive control chart platform called Control Chart Builder. When you need to detect smaller shifts in a process or monitor multiple process characteristics simultaneously, see Chapter 5, “Cumulative Sum Control Charts” and Chapter 6, “Multivariate Control Charts” respectively.
|
|
•
|
|
•
|
Quality and Process Methods Examples