Launch the Choice platform by selecting Analyze > Consumer Research > Choice.
The Choice platform is unique because it is designed to use data from one, two or three different data tables. Typically, data are in three separate tables: Profile Data, Response Data, and Subject Data. Each data table contains information that is joined together by the platform to extract the necessary data for Choice analysis. There are three sections of the Choice Launch Window. Each section corresponds to a different data table. If all your data are contained in one table, you can use the Choice platform, but additional effort is necessary. See the section One-Table Analysis.
Profile data describe the attributes associated with each choice. Each choice can comprise many different attributes, and each attribute is listed as a column in the data table. There is a row for each possible choice, and each possible choice contains a unique ID. Example of Profile Data Table and Dialog Window illustrates an example Profile Data table.
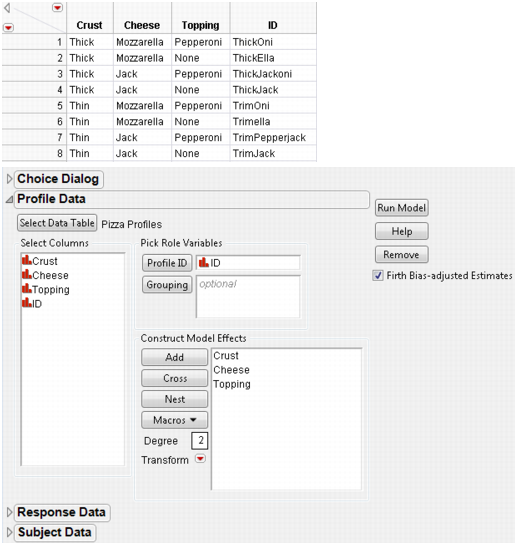
Link to profile data table. You can select from any of the data sets already open in the current JMP session, or you can select Other. Selecting Other enables you to open a file that is not currently open.
Identifier for each row of choice combinations. If the Profile ID column does not uniquely identify each row in the profile data table, you need to add Grouping columns. Add Grouping columns until the combination of Grouping and Profile ID columns uniquely identify the row, or profile.
With the Profile ID, unique identifier of each row, or profile. For example, if Profile ID = 1 for Survey = A, and a different Profile ID = 1 for Survey = B, then Survey would be used as a Grouping column.
For information about the Construct Model Effects window, see the Construct Model Effects section in the Introduction to Fit Model chapter of the Fitting Linear Models book.
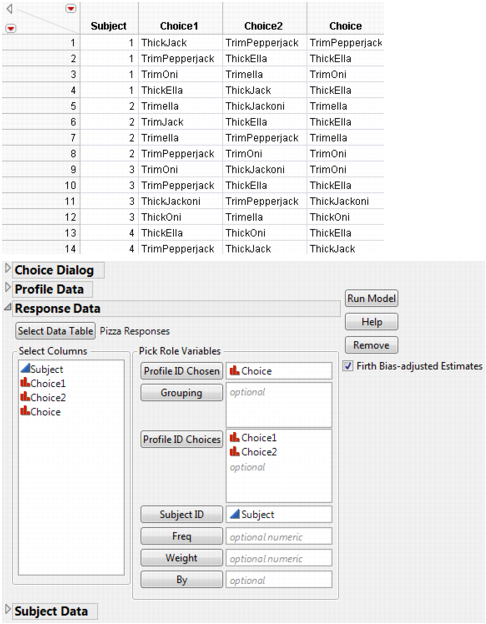
Response data contain the experimental results and have the choice set IDs for each trial as well as the actual choice selected by the subject. Each subject usually has several trials, or choice sets, to cover several choice possibilities. There can be more than one row of data for each subject. For example, an experiment might have 100 subjects with each subject making 12 choice decisions, resulting in 1200 rows in this data table. The Response data are linked to the Profile data through the choice set columns and the actual choice response column. Choice set refers to the set of alternatives from which the subject makes a choice. Grouping variables are sometimes used to align choice indices when more than one group is contained within the data.
Link to response data table. You can select from any of the data sets already open in the current JMP session, or you can select Other. Selecting Other enables you to open a file that is not currently open.
The Profile ID from the Profile data table of the choice the subject selected.
With the Profile ID Choices, unique identifier of each choice profile.
The Profile IDs of the set of possible choices.
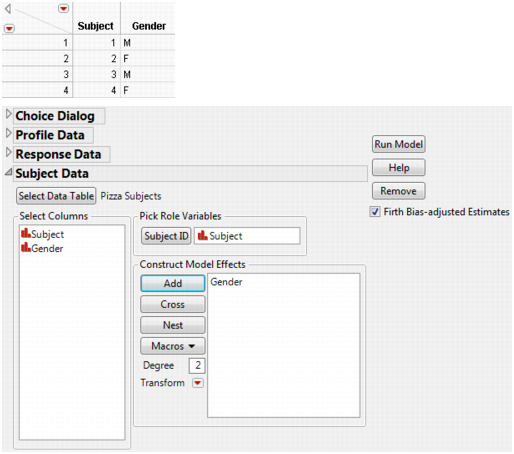
The Subject ID from the Subject data table.
The frequency of the observations. If n is the value of the Freq variable for a given row, then that row is used in computations n times. If it is less than 1 or missing, then JMP does not use it to calculate any analyses.
Link to subject data table. You can select from any of the data sets already open in the current JMP session, or you can select Other. Selecting Other enables you to open a file that is not currently open.
For information about the Construct Model Effects window, see the Construct Model Effects section in the Introduction to Fit Model chapter of the Fitting Linear Models book.
If you are scripting the Choice platform, you can also set the acceptable criterion for convergence when estimating the parameters by adding this command to the Choice() specification:
See the JMP Scripting Index in the Help menu for an example.
An example of the Choice Model Output results is shown in Choice Model Results with No Subject Data for Pizza Example.
|
•
|
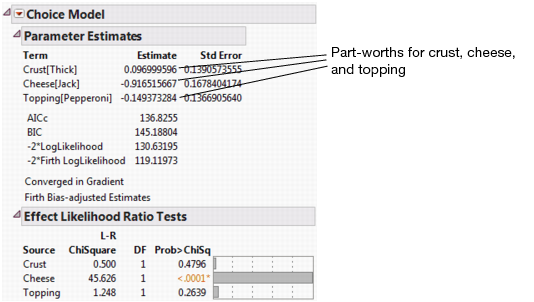
The resulting parameter estimates are sometimes referred to as part-worths. Each part-worth is the coefficient of utility associated with that attribute. By default, these estimates are based on the Firth bias-corrected maximum likelihood estimators and therefore are considered to be more accurate than MLEs without bias correction.
|
where k is the number of estimated parameters in the model and n is the number of observations in the data set. The BIC formula is: − 2 LogLikelihood + k ∗ ln(n), where k parameters is fitted to data with n observations and LogLikelihood is the maximized log-likelihood. Note that the − 2 Firth Loglikelihood result is included only in the report when the Firth Bias-adjusted Estimates check box is checked in the launch window. (See Example of Profile Data Table and Dialog Window.) This option is checked by default. The decision to use or not use the Firth Bias-adjusted Estimates does not affect the AICc score or the − 2 LogLikelihood results.
|
•
|