Means/Anova and Means/Anova/Pooled t
The Means/Anova option performs an analysis of variance. If the X factor contains exactly two levels, this option appears as Means/Anova/Pooled t. In addition to the other reports, a t-test report assuming pooled (or equal) variances appears.
|
Measures the proportion of the variation accounted for by fitting means to each factor level. The remaining variation is attributed to random error. The R2 value is 1 if fitting the group means accounts for all the variation with no error. An R2 of 0 indicates that the fit serves no better as a prediction model than the overall response mean. For more information, see Statistical Details for the Summary of Fit Report.
|
|
|
Adjusts R2 to make it more comparable over models with different numbers of parameters by using the degrees of freedom in its computation. For more information, see Statistical Details for the Summary of Fit Report.
|
|
|
Estimates the standard deviation of the random error. It is the square root of the mean square for Error found in the Analysis of Variance report.
|
|
There are two types of t-Tests:
|
•
|
Equal variances. If you select the Means/Anova/Pooled t option, a t-Test report appears. This t-Test assumes equal variances.
|
|
•
|
Unequal variances. If you select the t-Test option from the red triangle menu, a t-Test report appears. This t-Test assumes unequal variances.
|
|
Shows the level of confidence (1-alpha). To change the level of confidence, select a new alpha level from the Set α Level command from the platform red triangle menu.
|
|
|
Value of the t-statistic.
|
|
|
The p-value associated with a two-tailed test.
|
|
|
The p-value associated with a lower-tailed test.
|
|
|
The p-value associated with an upper-tailed test.
|
The Analysis of Variance report partitions the total variation of a sample into two components. The ratio of the two mean squares forms the F ratio. If the probability associated with the F ratio is small, then the model is a better fit statistically than the overall response mean.
Note: If you specified a Block column, then the Analysis of Variance report includes the Block variable.
|
Lists the three sources of variation, which are the model source, Error, and C. Total (corrected total).
|
|||||
The Error degrees of freedom is the difference between the C. Total degrees of freedom and the Model degrees of freedom (in other words, N - k).
|
|||||
|
|||||
|
|||||
|
Model mean square divided by the error mean square. If the hypothesis that the group means are equal (there is no real difference between them) is true, then both the mean square for error and the mean square for model estimate the error variance. Their ratio has an F distribution. If the analysis of variance model results in a significant reduction of variation from the total, the F ratio is higher than expected.
|
|||||
|
Probability of obtaining (by chance alone) an F value greater than the one calculated if, in reality, there is no difference in the population group means. Observed significance probabilities of 0.05 or less are often considered evidence that there are differences in the group means.
|
If you have specified a Block variable on the launch window, the Means/Anova and Means/Anova/Pooled t commands produce a Block Means report. This report shows the means for each block and the number of observations in each block.
|
•
|
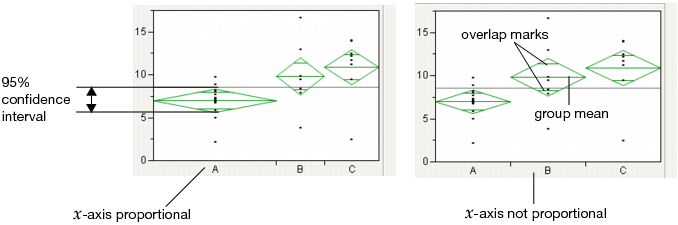
If the X-Axis proportional option is selected, the horizontal extent of each group along the x-axis (the horizontal size of the diamond) is proportional to the sample size for each level of the X variable. Therefore, the narrower diamonds are usually taller, because fewer data points results in a wider confidence interval.
|
|
•
|
Overlap marks appear as lines above and below the group mean. For groups with equal sample sizes, overlapping marks indicate that the two group means are not significantly different at the given confidence level. Overlap marks are computed as group mean ±
|
|
•
|
The mean diamonds automatically appear when you select the Means/Anova/Pooled t or Means/Anova option from the platform menu. However, you can show or hide them at any time by selecting Display Options > Mean Diamonds from the red triangle menu.
|
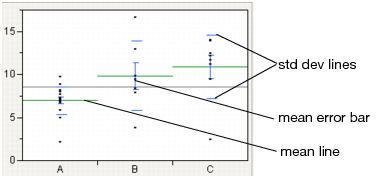
Show mean lines by selecting Display Options > Mean Lines. Mean lines indicate the mean of the response for each level of the X variable.
Mean error bars and standard deviation lines appear when you select the Means and Std Dev option from the red triangle menu. See Mean Lines, Mean Error Bars, and Std Dev Lines. To turn each option on or off singly, select Display Options > Mean Error Bars or Std Dev Lines.