|
•
|
Note: For -LogLikelihood, BIC, and AICc, smaller is better. For more details, see Likelihood, AICc, and BIC in Statistical Details.
An extension of the RSquare measure that can be applied to general regression models. Generalized RSquare compares the likelihood of the fitted model (LM) to the likelihood of the intercept-only (constant) model (L0). It is scaled to have a maximum of 1. The Generalized RSquare is defined as follows:
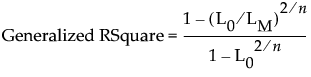
A Generalized RSquare value of 1 indicates a perfect model; a value of 0 indicates a model that is no better than a constant model. The Generalized RSquare measure simplifies to the traditional RSquare for continuous normal responses in the standard least squares setting. Generalized RSquare is also known as the Nagelkerke or Craig and Uhler R2, which is a normalized version of Cox and Snell’s pseudo R2. See Nagelkerke (1991).
The Estimation Details report shows the settings of the Advanced Controls for the Lasso, Elastic Net, and Ridge estimation methods. For more information about these controls, see Advanced Controls.
The Parameter Estimates are plotted using the vertical axis of the Solution Path plot. These are the scaled parameter estimates. They are derived for a model expressed in terms of centered and scaled predictors (see Parameter Estimates for Centered and Scaled Predictors).
The horizontal scaling for the Solution Path and Validation plot is given in terms of the Magnitude of Scaled Parameter Estimates. This is the l1 norm, defined as the sum of the absolute values of the scaled parameter estimates for the model for the mean. (Estimates corresponding to the intercept, dispersion parameters, and zero-inflation parameters are excluded from the calculation of the l1 norm.) A vertical red line is placed at the value of the l1 norm for the solution displayed in the Parameter Estimates for Original Predictors report.
The Validation Plot vertical axis varies based on the Validation Method chosen. Validation Plot Vertical Axis by Validation Method illustrates the vertical axis by Validation Method. For all vertical axis options, lower values are better. A vertical red line is placed at the value of the l1 norm tuning parameter for the solution displayed in the Parameter Estimates for Original Predictors report. There is some room for adjustment of the tuning parameter. You can move the red vertical line to the left or right to adjust the tuning parameter. A dashed vertical line remains at the best fit model. For AICc, BIC, KFold, and Leave-One-Out validation methods, the graph indicates regions where the tuning parameter is best kept.
Tip: You can use the green region to help select a simpler model that is no worse than the best model.
The p-value for the Wald test.
The p-value for the Wald test.
The p-value for the Wald ChiSquare test.