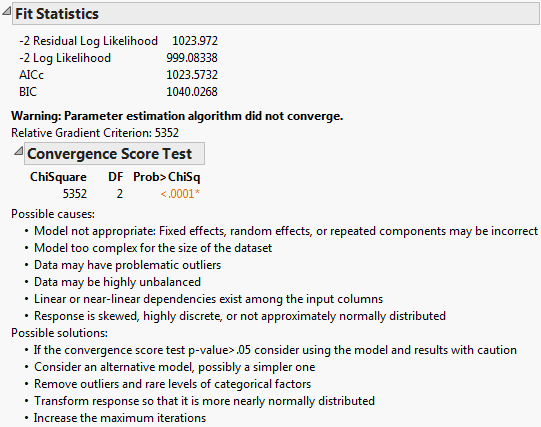
The Fit Statistics report gives statistics used for model comparison. For all fit statistics, smaller is better. A likelihood ratio test between two models can be performed if one model is contained within the other. If not, a cautious comparison of likelihoods can be informative. For an example, see Fit a Spatial Structure Model.
Description of Fit Statistics Report uses the following notation:
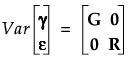
Here y is the nx1 vector of observations,  is a vector of fixed-effect parameters, γ is a vector of random-effect parameters, and ε is a vector of errors.
|
•
|

|
•
|
With these assumptions, the variance of y is given as follows:
|
|
and p is the rank of X. Use the residual likelihood only for model comparisons where the fixed effects portion of the model is identical. For more details, see Likelihood, AICc, and BIC in Statistical Details.
|
|
If there are problems with model convergence, a warning message is displayed below the fit statistics. Convergence Score Test shows the warning that suggests the cause and possible solutions to the convergence issue. It also includes a test of the relative gradient at the final iteration. If this test is non-significant, the model might be correct but not fully reaching the convergence criteria. In this case, consider using the model and results with caution. For details, see Convergence Score Test.
|
•
|
a t test for the hypothesis that the estimate equals zero
|
|
Gives the model term corresponding to the estimated parameter. The first term is always the intercept, unless you selected the No Intercept option in the Fit Model launch window. Continuous columns that are part of higher order terms are centered by default. Nominal or ordinal effects appear with values of levels in brackets. See Statistical Details for information about the coding of nominal and ordinal terms.
|
|
|
Tests whether the true value of the parameter is zero. The t Ratio is the ratio of the estimate to its standard error. Given the usual assumptions about the model, the t Ratio has a Student’s t distribution under the null hypothesis.
|
|
The Repeated Effects Covariance Parameter Estimates report provides details for the covariance parameters of the repeated effects that you specified in the model. It includes the Estimate, Standard Error, and 95% confidence bounds for each parameter. For isotropic spatial models, the covariance parameter estimates have interpretations in terms of range, nugget, and sill. See Variogram.
For each random effect in the model, this report gives an estimate known as the best linear unbiased predictor (BLUP), its standard error, and a Wald-based confidence interval.
This report shows a significance test for each fixed effect in the model. The test for a given effect tests the null hypothesis that all parameters associated with that effect are zero. An effect might have only one parameter as for a single continuous explanatory variable. In this case, the test is equivalent to the t test for that term in the Fixed Effects Parameter Estimates report. A nominal or ordinal effect can have several associated parameters, based on its number of levels. The effect test for such an effect tests whether all of the associated parameters are zero.
|
Gives the computed F ratio for testing that the effect is zero.
|
|
|
Gives the p-value for the effect test.
|