Model Comparison shows the Model Comparison Report.
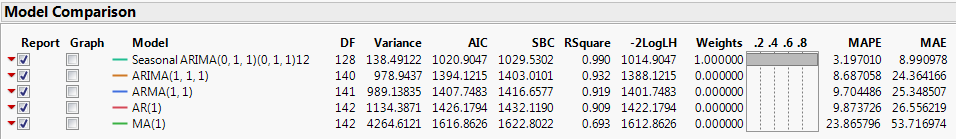
The Model Comparison table summarizes the fit statistics for each model. You can use it to compare several models fitted to the same time series. Each row corresponds to a different model. The models are sorted by the AIC statistic. The Model Comparison table shown above summarizes the Seasonal ARIMA (0, 1, 1)(0, 1, 1)12 and ARIMA models (1, 0, 0), (0, 0, 1), (1, 0, 1), and (1, 1, 1) respectively. Use the Report checkbox to show or hide the Model Report for a model.
provides one simulation of the model out k time periods. The simulation is shown on the Model Comparison time series plot. To change k, use the Number of Forecast Periods option on the platform red-triangle menu.
provides the specified number of simulations of the model out k time periods. The simulations are shown on the Model Comparison time series plot. To change k, use the Number of Forecast Periods option on the platform red-triangle menu.
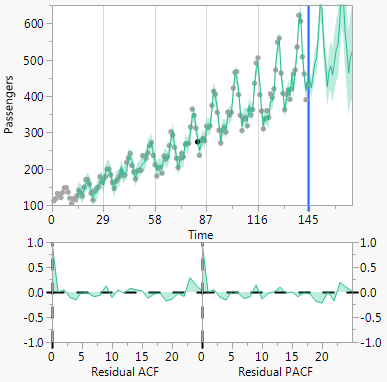
The Model Comparison report provides plots for a model when the Graph checkbox is selected. Model Plots shows the plots for the Seasonal ARIMA (0, 1, 1)(0, 1, 1)12 model.
Each model fit generates a Model Summary table, which summarizes the statistics of the fit. In the formulae below, n is the length of the series and k is the number of fitted parameters in the model.
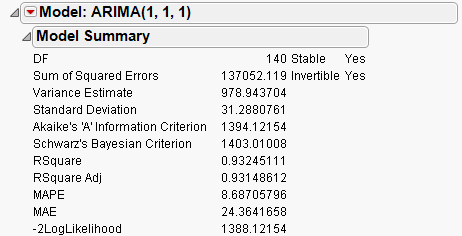
the unconditional sum of squares (SSE) divided by the number of degrees of freedom, SSE / (n – k). This is the sample estimate of the variance of the random shocks at, described in the section ARIMA Model.
is the square root of the variance estimate. This is a sample estimate of the standard deviation of at, the random shocks.
 and
and 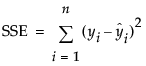 ,
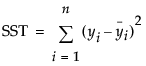
, If the model fits the series badly, the model error sum of squares, SSE might be larger than the total sum of squares, SST and R2 will be negative.

is minus two times the natural log of the likelihood function evaluated at the best-fit parameter estimates. Smaller values are better fits. See Fitting Linear Models.
indicates whether the moving average operator is invertible. That is, whether all the roots of  lie outside the unit circle.
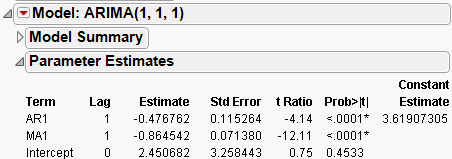
lists the name of the parameter. These are described below for each model type. Some models contain an intercept or mean term. In those models, the related constant estimate is also shown. The definition of the constant estimate is given under the description of ARIMA models.
lists the test statistics for the hypotheses that each parameter is zero. It is the ratio of the parameter estimate to its standard error. If the hypothesis is true, then this statistic has an approximate Student’s t-distribution. Looking for a t-ratio greater than 2 in absolute value is a common rule of thumb for judging significance because it approximates the 0.05 significance level.
lists the observed significance probability calculated from each t-ratio. It is the probability of getting, by chance alone, a t-ratio greater (in absolute value) than the computed value, given a true hypothesis. Often, a value below 0.05 (or sometimes 0.01) is interpreted as evidence that the parameter is significantly different from zero.
The Parameter Estimates table also gives the Constant Estimate, for models that contain an intercept or mean term. The definition of the constant estimate is given under ARIMA Model.
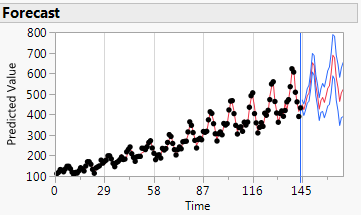
You can control the number of forecast values by changing the setting of the Forecast Periods box in the platform launch dialog or by selecting Number of Forecast Periods from the Time Series drop-down menu. The data and confidence intervals can be toggled on and off using the Show Points and Show Confidence Interval commands on the model’s popup menu.
controls which displays of residual statistics are shown for the model. These displays are described in the section Time Series Commands; however, they are applied to the residual series.