The individual plot options are the same as those in the Y Options submenu at the platform level. See Y Options.
|
Overlays groups and produces a legend. This option is off by default and unavailable if no grouping variables are assigned. See Overlay Groups.
Turns off overlaying for both Ys and groups. Creates a separate plot for each Y and each group. This option is off by default unless only one Y variable is assigned and no grouping variables are assigned. In this case, no overlaying options are available.
|
|
|
Assigns each plot its own set of xy-axes. If Separate Axes is off, the vertical axis is shared across the same row of plots and the horizontal axis is shared on the same column of plots. The default setting is on (except when multiple plots exist). See Separate Axes.
|
|
|
Connects the lowest and highest points at each x value with a line with bars at each end. The Needle and Range Plot options are mutually exclusive.
|
|
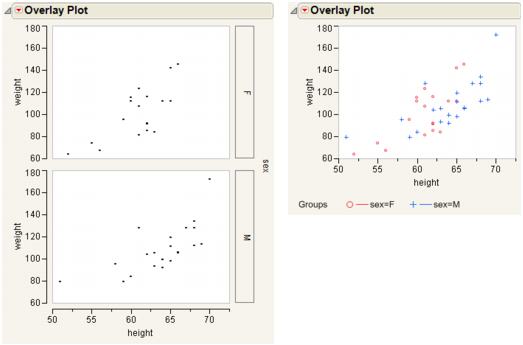
Overlay Groups: Off (left) and On (right) shows the effect that the Overlay Groups option has on an overlay plot with one Y variable, one X variable, and a grouping variable. The grouping variable has two levels. The plot on the left has Overlay Groups turned off, so a separate graph is produced for the two levels of the grouping variable. The plot on the right has Overlay Groups turned on, so there is a single graph that uses colors and markers to show the two levels of the grouping variable. A legend describing the levels is added under the graph.
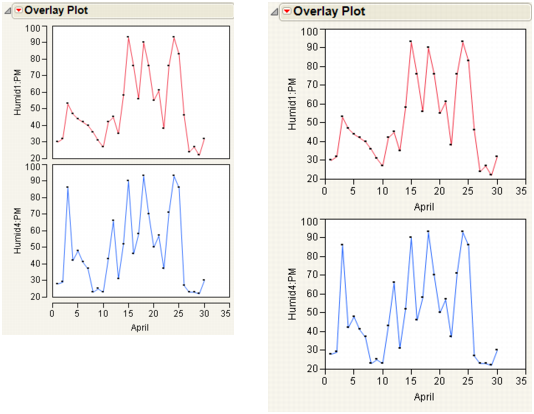
Separate Axes: Off (left) and On (right) shows the effect that the Separate Axes option has on an overlay plot with two Y variables and one X variable. The Overlay Y’s option is turned off, so a separate plot is produced for each Y variable. The plot on the left has Separate Axes turned off, so the two graphs share a single x-axis. The plot on the right has Separate Axes turned on, so both graphs have their own x-axis.
Each Y variable is labeled in a legend beneath the plot. The Y options are available from the Y Options menu from the red triangle menu for Overlay Plot. You can also access the Y Options menu by right-clicking on any Y variable in the legend.
|
A toggle that either connects the points with lines or turns the connecting lines off. You can use Connect Points without showing points.
|
|
|
Draws a horizontal line from each point to the x value of the following point, and then a vertical line to that point. You can use Step without showing points.
|
|
|
Enables the choice of line widths.
|
|