You can also use JMP to segment by clustering subjects using response data. For example, after running the model using the Pizza Profiles.jmp, Pizza Responses.jmp, and the optional Pizza Subjects.jmp data sets, select the red triangle menu for the Choice Model platform and select Save Gradients by Subject. A new data table is created containing the average Hessian-scaled gradient on each parameter, and there is one row for each subject.
These gradient values are the subject-aggregated Newton-Raphson steps from the optimization used to produce the estimates. At the estimates, the total gradient is zero, and Δ = H-1g = 0, where g is the total gradient of the log-likelihood evaluated at the MLE, and H-1 is the inverse Hessian function or the inverse of the negative of the second partial derivative of the log-likelihood.
But, the disaggregation of Δ results in
where i is the subject index, j is the choice response index for each subject, Δij are the partial Newton-Raphson steps for each run, and gij is the gradient of the log-likelihood by run.
 ,
,where ni is the number of runs per subject. These Δi are related to the force that subject i is applying to the parameters. If groups of subjects have truly different preference structures, these forces are strong, and they can be used to cluster the subjects. The Δi are the gradient forces that are saved. You can then cluster these values using the Clustering platform.
|
1.
|
Select Help > Sample Data Library and open Pizza Profiles.jmp, Pizza Responses.jmp, and Pizza Subjects.jmp.
|
|
2.
|
|
3.
|
Select Select Data Table under Profile Data.
|
|
4.
|
Select Pizza Profiles.jmp.
|
The columns from this table now populate the field under Select Columns in the Choice Dialog box.
|
5.
|
|
6.
|
|
7.
|
Open the Response Data section of the window and click Select Data Table.
|
|
8.
|
Select Pizza Responses.jmp.
|
|
9.
|
|
10.
|
|
11.
|
|
12.
|
Open the Subject Data section of the window and click Select Data Table.
|
|
13.
|
Select Pizza Subjects.jmp.
|
|
14.
|
|
15.
|
|
16.
|
Click Run Model.
|
|
1.
|
In the Choice Model red triangle menu, select Save Gradients by Subject.
|
A new data table is generated, with gradient forces saved for each main effect and subject interaction. A partial data table with these subject gradient forces is shown in Gradients by Subject for Pizza Data.

|
2.
|
|
3.
|
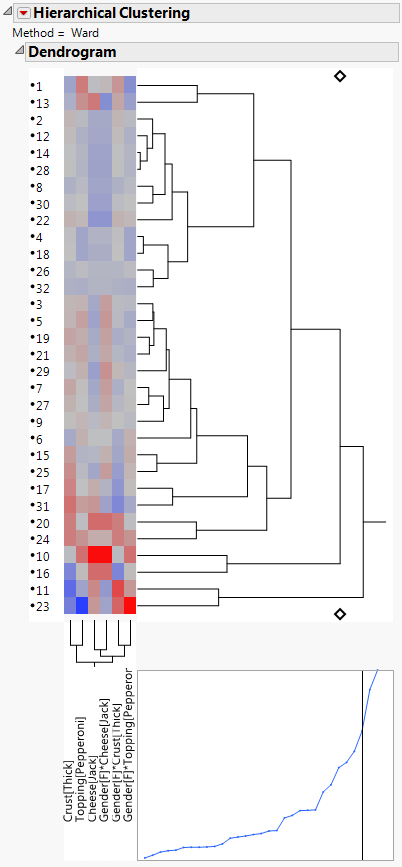
Save the cluster IDs by clicking on the red triangle menu of Hierarchical Clustering and selecting Save Clusters.
|
A new column called Cluster is created in the data table containing the gradients. Each subject has been assigned a Cluster value that is associated with other subjects having similar gradient forces. Refer to the Cluster platform chapter in the Multivariate Methods book for a discussion of other Hierarchical Clustering options. The gradient columns can be deleted because they were used only to obtain the clusters.
|
4.
|
Select all columns except Subject and Cluster. Right-click on the selected columns and select Delete Columns.
|
The data table shown in Merge Results Back into Original Table contains only Subject and Cluster variables.
|
5.
|
Click Run Script under the Merge Data Back red triangle menu, as shown in the partial gradient-by-subject table in Gradients by Subject for Pizza Data.
|
The columns in the Subject data table are now Subject, Gender, and Cluster, as shown in Subject Data with Cluster Column.

|
1.
|
|
2.
|
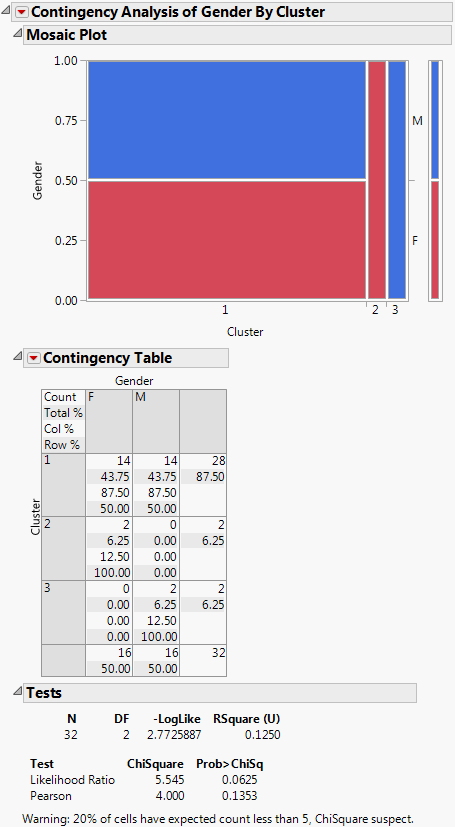
Contingency Analysis of Gender by Cluster for Pizza Example shows that Cluster 1 contains half male and female, Cluster 2 is only female, and Cluster 3 is all male. If desired, you could now refit and analyze the model with the addition of the Cluster variable.