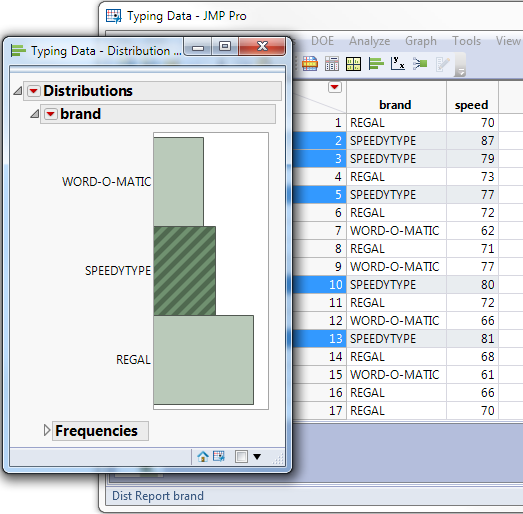
All graphs and plots that represent the same data table are linked to each other and to the corresponding data table. When you click points in plots or bars of a graph, the corresponding rows highlight in the data table. The example in Highlighting Rows in a Histogram shows a histogram with the SPEEDYTYPE bar highlighted, and the corresponding rows highlighted in the table. You can also extend the selection of bars in a histogram by holding down the Shift key and then making your selection.
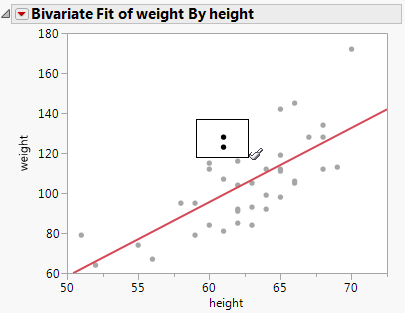
You can select all points that fall in a rectangular area using the arrow cursor. Click and drag the arrow to highlight points. Alternatively, you can use the brush tool. As you move the brush over the graph, points that fall within the rectangle are selected. Any points marked in the data table as hidden are not selected. See Hide Rows and Columns in Enter and Edit Data.
|
‒
|
To change the size of the selection rectangle, press the Alt key before you click in the plot. Drag the cursor to resize the selection box. This shape acts like a slicing tool that can traverse and highlight slices of points across either axis. Note: The size of the selection box is remembered for the next time you use the brush tool.
|
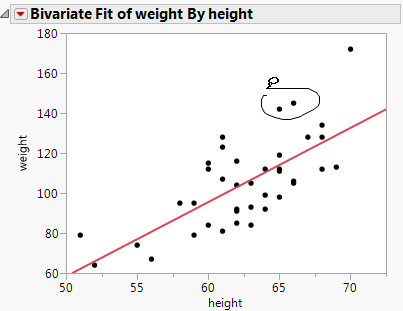
You can use the lasso tool to select points that fall in an irregular-shaped area. Any points marked in the data table as hidden are not selected. See Hide Rows and Columns in Enter and Edit Data.