|
•
|
|
•
|
|
•
|
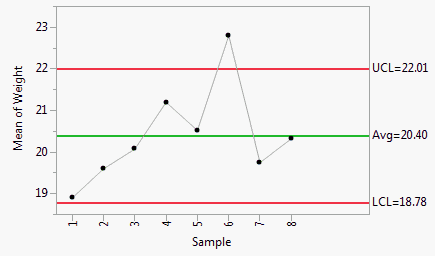
Technically Speaking – Using Statistical Process Controls to Improve and Monitor Your Process
Learn about the benefits of statistical process control, and watch a case study that demonstrates how SPC can be used to reduce variation and improve production processes.
Learn about the benefits of statistical process control, and watch a case study that demonstrates how SPC can be used to reduce variation and improve production processes.