You can rearrange your data table by stacking two or more columns into a single new column, preserving the values from the other columns. Or, you can stack a set of columns into multiple groups. The various ways that you can stack columns are explained in Description of the Stack Window.
|
1.
|
Select Tables > Stack.
|
|
2.
|
|
3.
|
|
4.
|
Click OK.
|
|
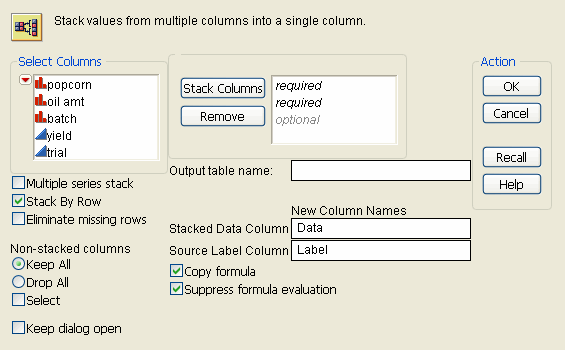
To stack selected columns into two or more columns, check the box beside Multiple series stack. Specify the number of columns into which you want the selected columns to be stacked by entering the number into the Number of Series box. This box appears when you check the box beside Multiple series stack.
Select the Contiguous option if the series consists of adjacent columns.
|
|
|
Leaving Stack by Row unchecked stacks one column underneath another. Checking it stacks columns by rows.
|
|
|
To eliminate missing data from the new table, check the box beside Eliminate missing rows. If Stack by Rows is checked also, only rows with all data missing are eliminated.
|
|
|
(Optional) To name the new table, type a name in the box beside Output table name.
|
|
|
To assign a name to the column that will contain the data for the stacked columns, enter a name in the Stacked Data Column box. Leave the box empty if you do not want this column to appear in the new table.
|
|
|
To assign a name to the column that will contain the original table’s column names, enter the name in the Source Label Column box. The default name is Label. Leave the box empty if you do not want this column to appear in the new table.
|
|
|
To prevent JMP from evaluating columns’ formulas when the new table is created, check the box beside Suppress formula evaluation.
|
|
1.
|
Open the Popcorn Trials.jmp sample data table.
|
|
2.
|
Select Tables > Stack.
|
|
3.
|
|
4.
|
Click OK.
|
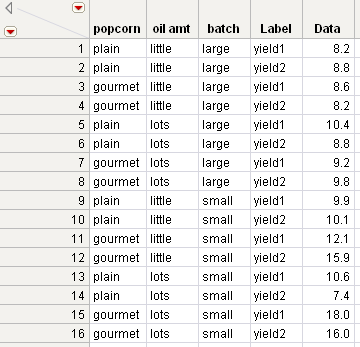
The Label column represents the Source Label Column that identifies the source of the data. Its values are the column names in the original table from which the stacked values originated.
|
1.
|
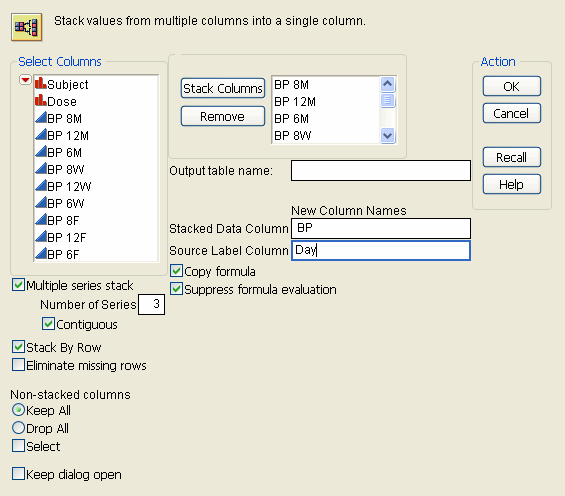
Open the Blood Pressure.jmp sample data table.
|
Each BP (blood pressure) column is delineated according to the date and time. The BP 8M column corresponds to readings that were taken at 8am on Monday. The BP 12W column corresponds to readings that were taken on 12pm on Wednesday, and so on. The researcher wants to stack all of the blood pressure columns into three columns that correspond to each day: Monday, Wednesday, and Friday.
|
2.
|
Select Tables > Stack.
|
|
3.
|
Select all of the BP readings and click Stack Columns.
|
|
4.
|
Select Multiple series stack.
|
|
5.
|
Next to Number of Series, type 3.
|
|
6.
|
|
7.
|
|
8.
|
|
9.
|
Click OK.
|
|
•
|
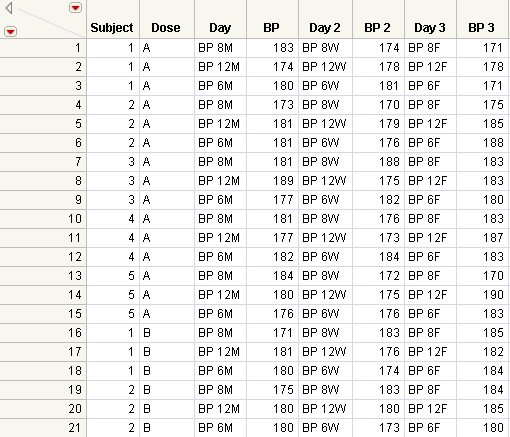
The first Day column represents Monday.
|
|
•
|
The Day 2 column represents Wednesday.
|
|
•
|
The Day 3 column represents Friday.
|