The Fit Curve report initially contains only a plot of Y versus X (Fit Curve Reports: No Grouping Variable (left) and with Group Variable (right)). If you specify a Group variable, the report includes overlaid and individual plots for each group of the fitted model (shown in Fit Curve Reports: No Grouping Variable (left) and with Group Variable (right) on the right).
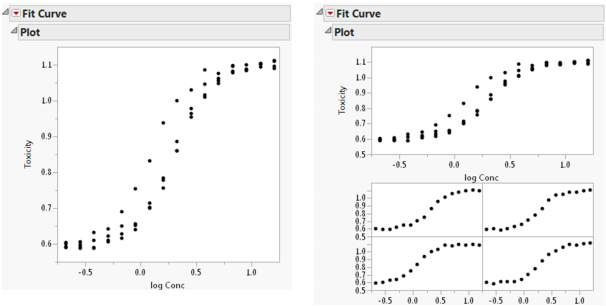
Before fitting a model, the Fit Curve report contains only a plot of Y versus X. After fitting a model, the fitted model is added to the plot (when no grouping variable is specified on the platform launch window). The report contains the following results:
To create the report shown in Model Comparison Report, select Sigmoid Curves > Logistic Curves > Fit Logistic 4P and Sigmoid Curves > Fit Gompertz 4P from the Fit Curve red triangle menu.
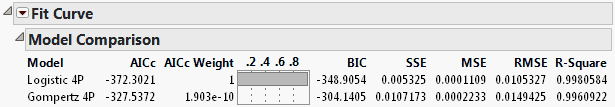
Gives a measure based on the likelihood function of model fit that is helpful when comparing different models. The model with the lower BIC value is the better fit. See Fitting Linear Models.
The Model Comparison platform provides additional options, such as plotting residual and actual values. See the Model Comparison section for more information.
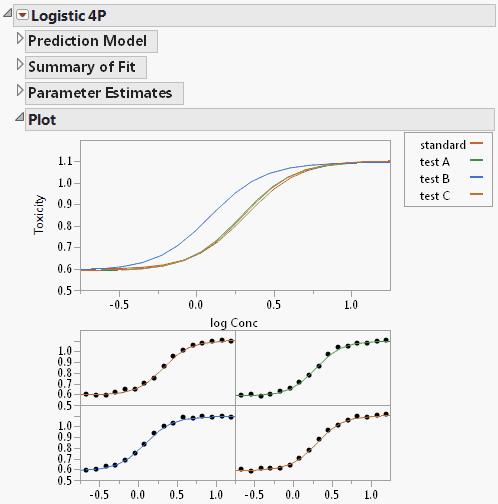
Gives plots of the data with the fitted model. See Initial Model Reports for Logistic 4P Model. The plots are shown only when you select a Grouping variable on the platform launch window.
Helps determine whether the curves are similar in shape when they are shifted along the x-axis. In certain situations, it is important to establish parallelism before making further comparisons between groups. This option is available only when a Group variable is specified on the platform launch window. This option is available for the Sigmoid models (Logistic and Gompertz), as well as the Linear Regression model, with the exception of higher-order polynomials. For details, see Test Parallelism.
Gives an analysis for testing the equality of parameters across levels of the grouping variable. This option is available only when a Group variable is specified on the platform launch window. For details, see Compare Parameter Estimates.
Gives an analysis for testing the equivalence of models across levels of the grouping variable. This option is available only when a Group variable is specified on the platform launch window. For details, see Equivalence Test.
Shows or hides a profiler of the fitted prediction function. The derivatives are derivatives of the prediction function with respect to the X variable. For more information about profilers, see the Profiler chapter in the Profilers book.
Save Prediction Formula saves the prediction equation.
Save Std Error of Predicted saves the standard error of the predicted values.
Save Parametric Prediction Formula saves the prediction equation in parametric form. This is helpful if you want to use the fitted model in the full personality of the Nonlinear platform.
Save Residual Formula saves the residuals.
Save Studentized Residual Formula saves the studentized residual formula, a standard residual that is divided by its estimated standard deviation.
Save First Derivative saves the derivative of the prediction function with respect to the X variable.
Save Std Error of First Derivative saves the equation of the standard error of the first derivative.
Predicts an X value for a specific Y value. For more information about inverse prediction, see the Multivariate Methods book.