After clicking OK from the launch dialog, the following report appears.
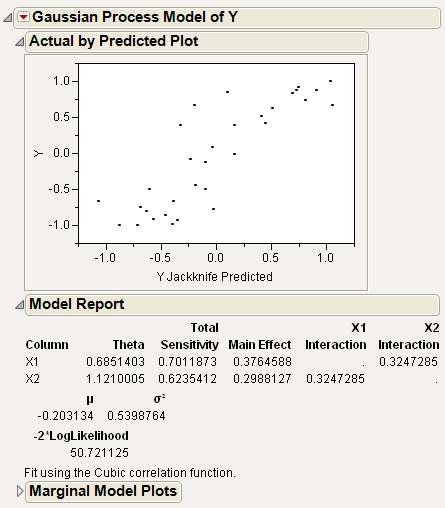
The Actual by Predicted plot shows the actual Y values on the y-axis and the jackknife predicted values on the x-axis. One measure of goodness-of-fit is how well the points lie along the 45 degree diagonal line.
For each covariate, we can create a marginal prediction formula by averaging the overall prediction formula over the values of all the other factors. The functional main effect of X1 is the integrated total variation due to X1 alone. In this case, we see that 37.6% of the variation in Y is due to X1.
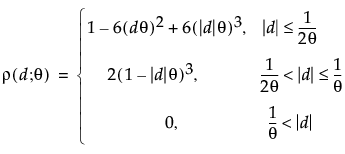
The Gaussian correlation structure uses the product exponential correlation function with a power of 2 as the estimated model. This comes with the assumptions that Y is Normally distributed with mean μ and covariance matrix σ2R. The R matrix is composed of elements
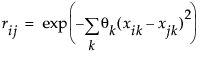
In the Model report, μ is the Normal distribution mean, σ2 is the Normal Distribution parameter, and the Theta column corresponds to the values of θk in the definition of R.
Note: If you see Nugget parameters set to avoid singular variance matrix, JMP has added a ridge parameter to the variance matrix so that it is invertible.
The Cubic correlation structure also assumes that Y is Normally distributed with mean μ and covariance matrix σ2R. The R matrix is composed of elements
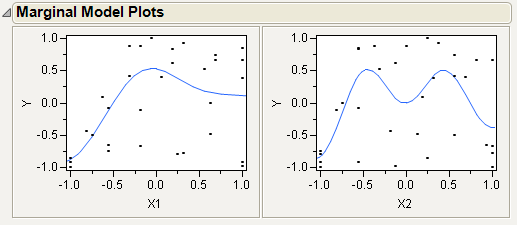
These plots show the average value of each factor across all other factors. In this two-dimensional example, we examine slices of X1 from –1 to 1, and plot the average value at each point.