Publication date: 07/30/2020
Add a Graph to a Data Table
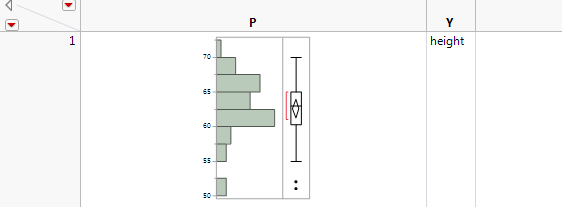
You can add a graph to a new data table. Right-click a graph and select Edit > Make table of graphs like this. The graph and the variables appear in a new data table. You then resize the row and column to enlarge the graph.
Figure 9.32 Histogram and Y Variable Added to Data Table
Want more information? Have questions? Get answers in the JMP User Community (community.jmp.com).