Analyze the Mixture Model
To analyze the Plasticizer experiment use the sample data table Plasticizer.jmp.
1. Select Help > Sample Data Library and open Plasticizer.jmp.
2. Click the green triangle next to the Model script in the upper left corner of the data table.
A completed Fit Model launch window appears.
Note: The model script is saved to the design table when you create a design.
3. Click Run to see the response surface analysis.
4. Plasticizer.jmp contains a column called Pred Formula Y. This column was added after the analysis by selecting Save Columns > Prediction Formula from the Response Y red triangle.
5. To see the prediction formula, click the plus symbol in the column list:
0–50.1465*p1 – 282.198*p2 – 911.648*p3 + p2*p1*317.363 + p3*p1*1464.330 + p3*p2*1846.218
Note: These results correct the coefficients reported in Cornell (1990).
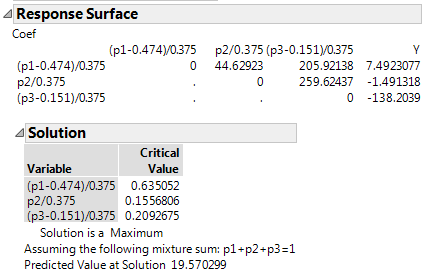
The Response Surface Solution report shows that a maximum predicted value of 19.570299 occurs at point (0.63505, 0.15568, 0.20927).
Figure 13.24 Mixture Response Surface Analysis