Publication date: 07/30/2020
CDF Plot
The CDF plot creates a plot of the empirical cumulative distribution function. Use the CDF plot to determine the percent of data that is at or below a given value on the horizontal axis.
Figure 3.10 CDF Plot
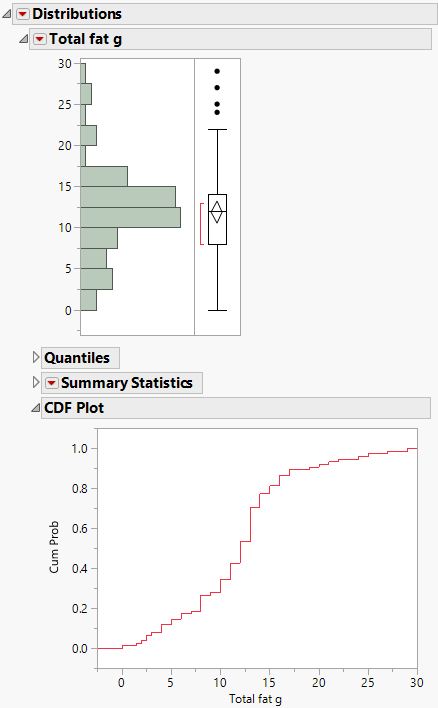
For example, in this CDF plot, approximately 34% of the data are less than a total fat value of 10 grams.
Want more information? Have questions? Get answers in the JMP User Community (community.jmp.com).