 Conditional Residual Plots
Conditional residuals reflect the prediction error based on fitting both fixed and random effects. Conditional residuals are the differences between actual values and the conditional predicted values obtained if you select Save Columns > Conditional Prediction Formula.
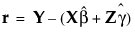
Denote the linear mixed model by E[Y|γ] = Xβ + Zγ. Here β is the vector of fixed effect coefficients and γ is the vector of random effect coefficients. The conditional residuals are given as follows:
The Conditional Residual Plots option provides three visual methods to assess model fit:
Conditional Residual by Predicted Plot
Shows the conditional residuals plotted against the conditional predicted values of Y. You typically want to see the conditional residual scattered randomly about zero.
Conditional Residual Quantile Plot
Shows the quantiles of the conditional residuals plotted against the quantiles of a standard normal distribution. Also shown is a bar chart of the conditional residuals. If the conditional residuals are normally distributed, the points on the normal quantile plot should approximately fall along the red diagonal line. This type of plot is also called a quantile‐quantile plot, or Q‐Q plot. The normal quantile plot also shows Lilliefors confidence bounds (Conover 1999).
Conditional Residual by Row Plot
Shows conditional residuals plotted against row numbers. This plot can help you detect patterns that result from the row ordering of the observations.