 Conduct a Permutation Test
In this example, you are studying the effects of three drugs on pain. You are interested in whether they differ in their effects. Because you have a very small sample size and are somewhat concerned about violations of the usual ANOVA assumptions, you can use Simulate to conduct a permutation test.
First, you construct a formula that randomly shuffles the pain measurements among the three drugs. Under the null hypothesis of no effect, any of these allocations is as likely as any other. It follows that the F ratios obtained in this manner approximate the distribution of F ratios under the null hypothesis. Finally, you compare the observed value of the F ratio to the null distribution obtained by simulation.
 Define the Simulation Formula
1. Select Help > Sample Data Library and open Analgesics.jmp.
2. Select Cols > New Columns.
3. Type Pain Shuffled for Column Name.
4. From the Column Properties list, select Formula.
5. In the function list, select Row > Col Stored Value.
6. In the Columns list, double-click pain.
7. Click the insert key (^) in the list of symbols above the editor panel.
8. From the list of functions, select Random > Col Shuffle.
Figure 10.8 Completed Formula
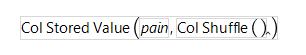
This formula randomly shuffles the entries in the pain column.
9. Click OK in the Formula Editor window.
10. Click OK in the Column Info window.
Perform the Permutation Test
1. Select Analyze > Fit Y by X.
2. Select pain and click Y, Response.
3. Select drug and click X, Factor.
4. Click OK.
5. Click the Oneway Analysis red triangle and select Means/Anova.
Figure 10.9 Analysis of Variance Report
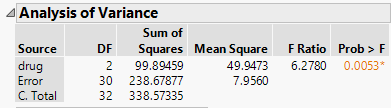
Notice that the F ratio is 6.2780.
6. In the Analysis of Variance outline, right-click the F Ratio column and select Simulate.
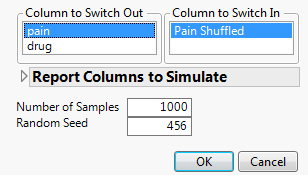
7. In the Column to Switch Out list, click pain.
8. In the Column to Switch In list, click Pain Shuffled.
9. Next to Number of Samples, enter 1000.
10. (Optional) Next to Random Seed, enter 456.
This reproduces the values in this example.
Figure 10.10 Completed Simulate Window
11. Click OK.
In the table of simulated results, the C. Total and Error columns are empty, since the F Ratio value in the Analysis of Variance table applies only to drug.
12. In the table of simulated values, run the Distribution script.
Figure 10.11 Simulated Distribution of F Ratios under the Null Distribution
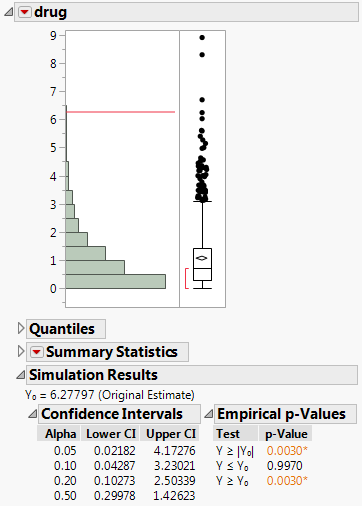
The observed F ratio value of 6.2780 is represented with a red line in the histogram. This value falls in the upper 0.5% of the simulated null distribution of F ratios. This presents strong evidence that the three drugs differ in their effects on pain.