Create the Design
To create Cornell’s mixture design in JMP
1. Select Help > Sample Data Library and open Plastifactors.jmp.
2. Select DOE > Classical > Mixture Design.
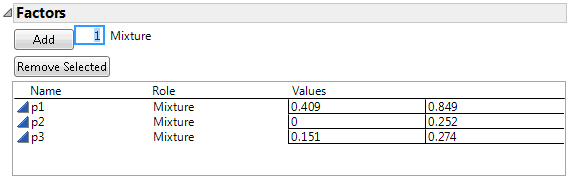
3. Click the Mixture Design red triangle and select Load Factors.
Figure 13.20 Factors and Factor Constraints for the Plasticizer Experiment
4. Click Continue.
5. Enter 3 in the Degree box.
6. Click Extreme Vertices.
7. Click Make Table. JMP uses the 9 factor settings to generate a JMP table.
Figure 13.21 Extreme Vertices Mixture Design
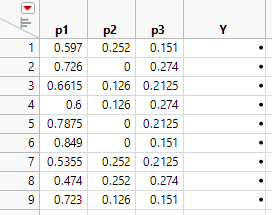
Note: Your table might differ due to the random seed used to generate the design.
Next, you add an extra five design runs by duplicating the vertex points and overall centroid, to generate the 14 run design.
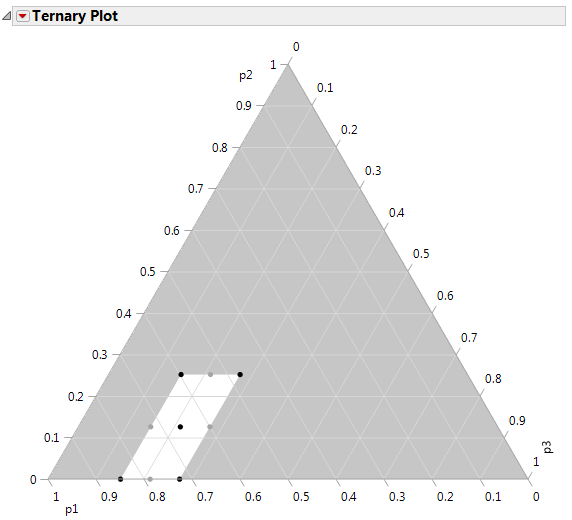
8. To identify the vertex points and the centroid use a ternary plot. From the design table, select Graph >Ternary Plot.
9. Select p1, p2, and p3 and click X, Plotting, and then click OK.
Figure 13.22 Ternary Plot for Design
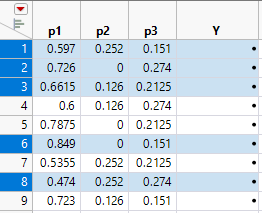
10. Highlight the vertices and centroid points.
Figure 13.23 Identify Vertices and Center Point
11. Select Edit > Copy, to copy the selected rows to the clipboard.
12. Click in the first cell of row 10 and select Edit > Paste to add the duplicate rows to the table.
Note: A similar design can be obtained using the custom designer with the quadratic model, 2 center points, 4 replicate designs, and 14 runs.
The Plasticizer design with the results (Y values) that Cornell obtained are available in the sample data file Plasticizer.jmp.