Defect Parametric Profiler
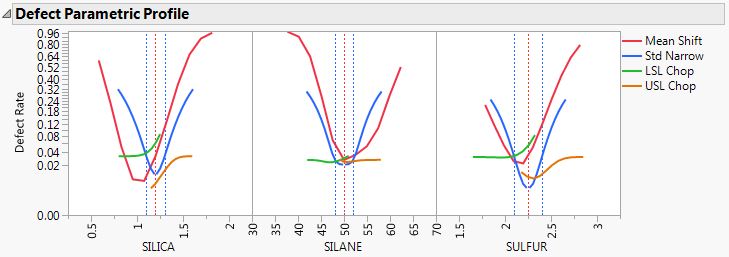
The Defect Parametric Profiler report shows the impact of process changes on the defect rate. The impacts are based on the simulation parameter settings for each factor. Four scenarios are considered.
Mean Shift
The impact of shifting the mean is shown by a red curve. The current mean is shown by a red dotted vertical line.
Std Narrow
The impact of a reduction in variability is shown by a blue curve. The dotted blue vertical lines are set at the mean plus and minus one standard deviation. The minimum value on the curve corresponds to the defect rate when there is no variability.
LSL Chop
The impact of inspection to remove all parts below the lower specification limit is shown by a green curve.
USL Chop
The impact of inspection to remove all parts above the upper specification limit is shown by an orange curve.
Figure 8.8 Defect Parametric Profile