Publication date: 07/30/2020
Display Coordinates and Temporary Reference Lines
You can measure points and distances in graphs, or easily find the exact value, or coordinates, of points and distances on plots and graphs. To do this, click the crosshairs tool  and click and hold anywhere on a graph. The coordinate values appear where the crosshairs intersect the vertical and horizontal axis as you drag the crosshairs within a plot.
Figure 9.25 Using the Crosshairs Tool
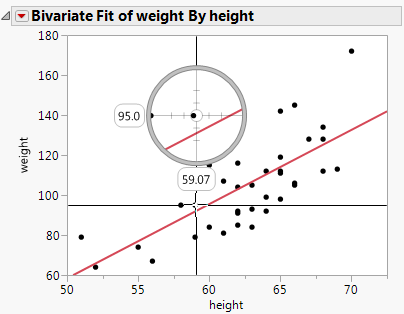
On a fitted line or curve, the crosshairs identify the response value for any predicted value. On a ternary plot, this tool displays triangular crosshair lines.
Want more information? Have questions? Get answers in the JMP User Community (community.jmp.com).