Drag and Drop an Image into a Graph
To add an image that you created, generate your report and then drag and drop the image from your computer’s file system onto the graph in the report. After you add the image, JMP provides several options such as resizing, formatting, and rotating an image. Right-click the image and select Image to see these options.
The following example shows a bivariate plot of wind speeds in the Chicago area. The plot on the left includes arrows to illustrate the wind direction and speed. A map image was dropped onto the plot and resized to line up the markers with the stations that provided the wind data (each dot representing a station).
Figure 9.38 Example of a Custom Map Image
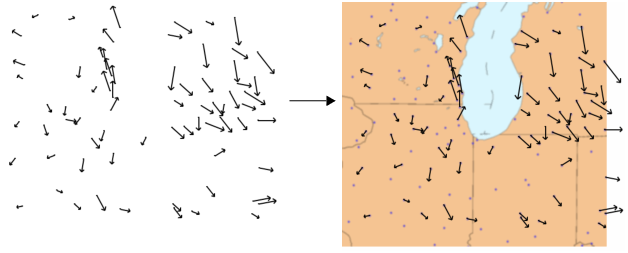
Image Processing
JMP includes a variety of image processing options. Image processing includes filters that can sharpen, blur, resize, and enhance. JMP also allows flipping, rotating, and locking images. This section describes the processing options.
Notes:
• Repeated changes to images can degrade the image quality. If you are not happy with the results of sizing, scaling, or applying filters to the image, remove the image and start again.
• All JMP image filters are supported at the operating system level; images might be processed differently on Windows and macOS.
Lock
Locks the image in place so that it cannot be moved.
Size/Scale
• Fill Graph: Resizes the image proportionately to fit the graph.
• Specify Size: Resizes the image according to the values that you enter. (The units for these values are the same as your graph axes.)
• Crop: Crops the image according to the values that you enter. (The units for these values are the same as your graph axes.) For example, the left edge might be positioned at 50. You enter 60 next to Left, and the portion of the image between 50 and 60 is removed from the image.
Flip
• Flip vertical: Flips the image top to bottom.
• Flip horizontal: Flips the image left to right.
• Flip both: Flips the image both horizontally and vertically.
Rotate
Rotates the image the specified number of degrees. Enter a negative value to rotate the image counterclockwise.
Transparency
Changes the image transparency level. Enter a value between 0 and 1 (where 1 is completely opaque).
Filter
Provides filters found in many graphic editing programs to change the appearance of the image. Select a filter repeatedly to increase its effects on the image.
• Contrast: Optimizes the light and dark colors. Larger values lighten the image.
• Despeckle: Removes pixels that do not blend with surrounding pixels. For example, a black pixel surrounded by white pixels is converted to a white pixel.
• Edge: Darkens everything but the outlines of objects.
• Enhance: Reduces the contrast between pixels in a noisy image.
• Gamma: Balances the brightness of an image and the red, green, and blue (RGB) ratios. Larger values create a lighter image.
• Gaussian Blur: Blurs pixels by the specified radius. Larger radii create a smoother image. (In JSL, you can also specify the sigma value. Larger sigma values create a smoother image.)
• Median: Replaces each pixel color value with the median value of the surrounding pixels.
• Negate: Converts each pixel to its complementary color (such as pink to green and white to black).
• Normalize: Removes a percentage of the top and bottom color values. The color values are then stretched to fill the remaining image. This process increases the intensity of the colors.
• Reduce Noise: Finds the minimum and maximum color values and replaces them with values more consistent with the surrounding pixels. Larger values create a smoother image.
• Sharpen: Makes the edges of pixels more distinct.
Remove
Removes the image from the report.