Publication date: 07/30/2020
Draw Markers
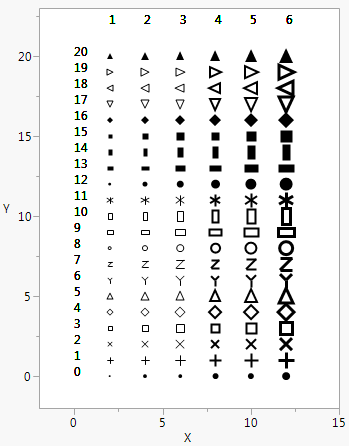
Marker() draws a marker of the type that you specify (1–20) in the first argument at the point that you specify in the second argument. Marker Size() scales markers from 0 to 6 (dot to XXXL). To set markers to the size that is specified in the Preferences, use a value of -1.
ymax = 20;
win = New Window( "Markers",
Graph Box(
Frame Size( 300, 400 ),
X Scale( -2, ymax - 5 ),
Y Scale( -2, ymax + 3 ),
For( j = 1, j < 7, j++,
Marker Size( j );
For( i = 0, i < (ymax + 1), i++,
Marker( i, {j * 2, i} );
Text( {0, i}, i );
Text( {j * 2, ymax + 2}, j );
);
)
)
);
Figure 12.13 Drawing Markers
You can also include a row state argument before, after, or instead of the marker ID argument. By using Combine States(), you can set multiple row states inside Marker(). Try substituting each of the following lines in the preceding script:
Marker( i, Color State( i ), {j * 2, i} );Marker( Color State( i ), i, {j * 2, i} );Marker(
Combine States( Color State( i ), Marker State( i ), Hidden State( i ) ),
{j * 2, i});
As with Line() and Arrow(), you can also specify points as matrices of x and then y coordinates.
Want more information? Have questions? Get answers in the JMP User Community (community.jmp.com).