Publication date: 07/30/2020
Dual Plot
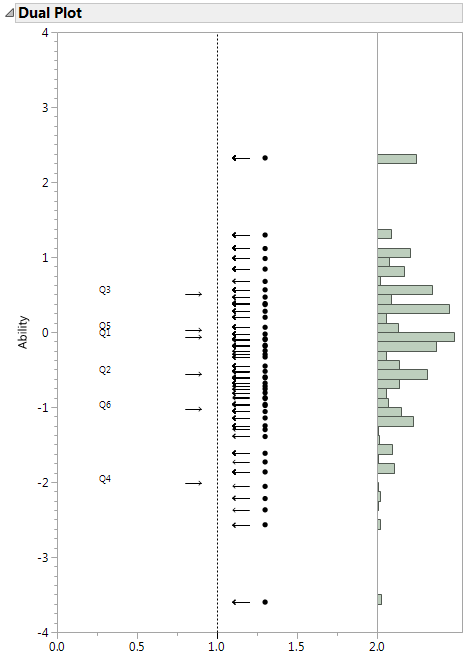
The Dual Plot report contains a plot that shows item difficulty and subject ability in one plot. Difficulty and ability use a common standardized scale shown on the y-axis. The items are plotted by their difficulty on the left side of the plot. The subjects are plotted to the right with data points and a histogram. The dual plot enables you to relate the difficulty of each item to the ability of each respondent.
Figure 11.7 Dual Plot
Want more information? Have questions? Get answers in the JMP User Community (community.jmp.com).