Publication date: 07/30/2020
EWMA Chart Example
The following example uses the Clips1.jmp data table.
1. Select Help > Sample Data Library and open Quality Control/Clips1.jmp.
2. Select Analyze > Quality and Process > Control Chart > EWMA.
3. Select Gap and click Process.
4. Select Sample and click Sample Label.
5. Change the Weight to 0.5.
6. Click OK.
Figure 9.3 EWMA Chart
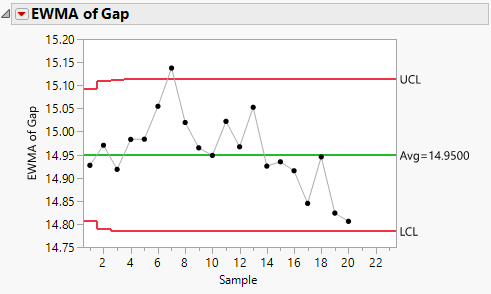
The EWMA chart appears for the same data shown in Figure 9.2. This EWMA chart was generated for weight = 0.5.
Want more information? Have questions? Get answers in the JMP User Community (community.jmp.com).