Examine Iris Measurements
The following example uses the Fisher’s Iris data set (Mardia, Kent, and Bibby 1979). The Iris.jmp sample data table contains measurements of the sepal length and width and petal length and width in centimeters for three species of Iris flowers: setosa, versicolor, and virginica. To find characteristics that differentiate the three species, examine these measurements.
Examine Three Species in One Parallel Plot
1. Select Help > Sample Data Library and open Iris.jmp.
2. Select Graph > Parallel Plot.
3. Select Sepal length, Sepal width, Petal length, and Petal width and click Y, Response.
4. Select the Scale Uniformly check box.
5. Click OK.
The report window appears.
Figure 7.10 Three Species in One Parallel Plot
In this parallel plot, the three species are all represented in the same plot. The colors correspond to the three species, as follows:
• Blue corresponds to virginica.
• Green corresponds to versicolor.
• Red corresponds to setosa.
From the parallel plot, you observe the following:
• For sepal width, the setosa values appear to be higher than the virginica and versicolor values.
• For petal width, the setosa values appear to be lower than the virginica and versicolor values.
Examine Three Species in Different Parallel Plots
1. From the Iris.jmp sample data table, select Graph > Parallel Plot.
2. Select Sepal length, Sepal width, Petal length, and Petal width and click Y, Response.
3. Select Species and click X, Grouping.
4. Click OK.
The report window appears.
Figure 7.11 Three Species in Different Parallel Plots
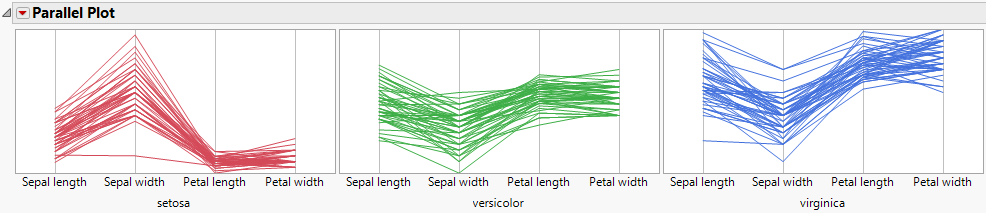
Each species is represented in a separate parallel plot.